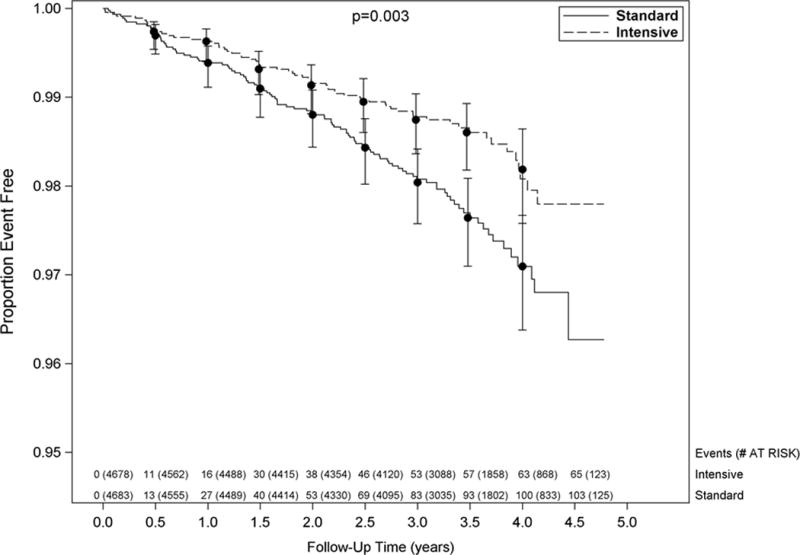
Figure 1.

Kaplan-Meier curves for the SPRINT acute decompensated heart failure outcome by treatment group. Vertical bars indicate 95% confidence intervals. P-value is from a Cox proportional hazards model stratified by clinical site. Number at risk and number of events is shown every six months.
