
Figure 2.
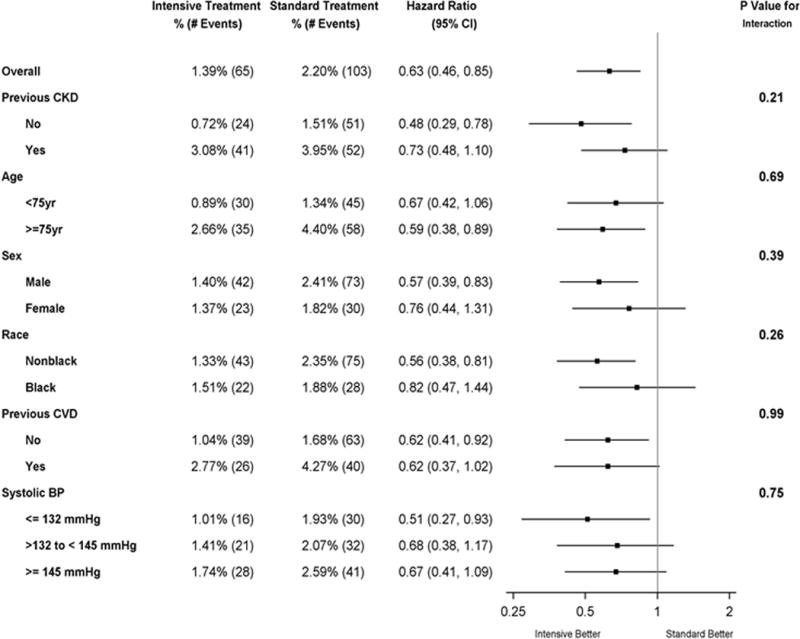
Forest plot of acute decompensated heart failure according to subgroups. The dashed vertical line represents the hazard ratio for the overall study population. The box sizes are proportional to the precision of the estimates (with larger boxes indicating a greater degree of precision). The subgroup of no previous chronic kidney disease (CKD) includes some participants with unknown CKD status at baseline. Black race includes Hispanic black and black as part of a multiracial identification.