

Abstract
Mechanisms that maintain cancer stem cells are crucial to tumor progression. The ID2 protein underpins cancer hallmarks including the cancer stem cell state. HIFα transcription factors, most notably HIF2α, are expressed in and required for maintenance of cancer stem cells (CSCs). However, the pathways that are engaged by ID2 or drive HIF2α accumulation in CSCs have remained unclear. We report that DYRK1A and DYRK1B kinases phosphorylate ID2 on Threonine-27 (T27). Hypoxia down regulates this phosphorylation via inactivation of DYRK1, whose activity is stimulated in normoxia by the oxygen sensing prolyl hydroxylase PHD1. ID2 binds to the VHL ubiquitin ligase complex, displaces VHL-associated Cullin-2, and impairs HIF2α ubiquitylation and degradation. Phosphorylation of ID2-T27 by DYRK1 blocks ID2-VHL interaction and preserves HIF2α ubiquitylation. In glioblastoma ID2 positively modulates HIF2α activity. Conversely, elevated expression of DYRK1 phosphorylates ID2- T27, leading to HIF2α destabilization, loss of glioma stemness, inhibition of tumor growth, and a more favorable outcome for patients with glioblastoma.
The HIFα (Hypoxia Inducible Factors alpha) transcription factors are the key mediators of the hypoxia response1. HIFα protein de-regulation in cancer can be triggered by mutation of the Von Hippel Lindau (VHL) gene, an event that hinders the negative control of HIFα protein stability by the ubiquitin ligase activity of VHL. This notion has been especially validated for HIF2α, the HIF isoform preferentially up-regulated in VHL-mutant tumors and recently implicated as driver of cancer stem cells2-5. However, signaling events that link the stem cell-intrinsic transcriptional machinery to pivotal mechanisms of HIF2α regulation in cancer remain to be charted.
ID proteins (ID1 to ID4) are master regulators of stem cells that are hijacked during tumorigenesis and foster self-renewal and angiogenesis6,7. While the pro-tumorigenic role of ID proteins has been linked to the accumulation of mRNAs and proteins, it remains unclear whether other mechanisms exist that deregulate ID activity in cancer cells. Among ID proteins, ID2 is essential for tumor angiogenesis and glioma stemness and is a component of the signature that predicts poor outcome in patients with high-grade glioma8-10.
We show that ID2 activity is restrained by DYRK1 kinase-mediated phosphorylation on T27 and hypoxia impairs this event by inhibiting DYRK1 activity. In hypoxic brain tumor cells, active ID2 binds to and disrupts the VHL complex, thus preventing ubiquitin-mediated proteasomal degradation of HIF2α. This is a novel mechanism that fosters cancer stem cells and aggressiveness of human cancer.
Hypoxia regulates phosphorylation of ID2 by DYRK1
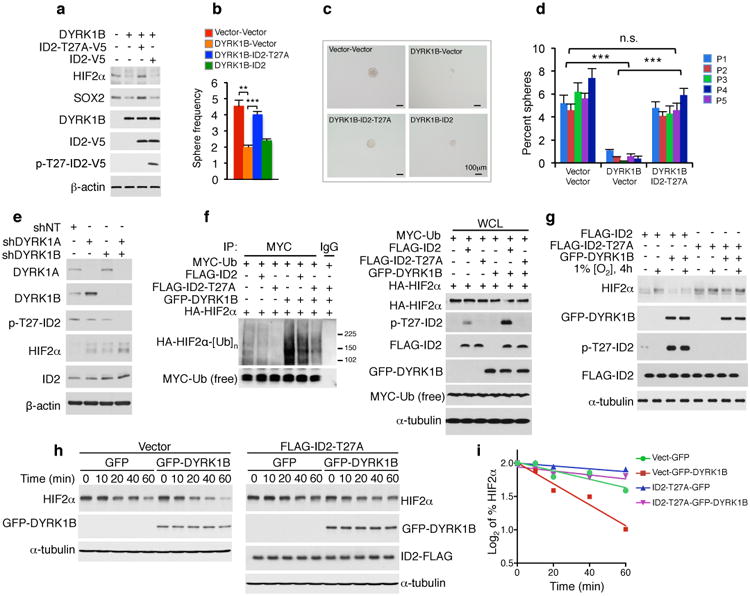
We used mass spectrometry to identify the phosphorylation sites of human ID2. Beside Serine-511, we found that ID2 is phosphorylated on Serine-14 and Threonine-27 (Extended Data Fig. 1a-c). A sequencing analysis of the ID2 gene in cancer revealed that the colorectal cancer cell line HRT-18 harbors and expresses a mutant ID2-T27A protein (Extended Data Fig. 2a, b). Threonine-27 of ID2 is highly conserved throughout evolution (Extended Data Fig. 2c). The primary role of ID proteins is to preserve stem cell properties, a function widely documented in neural stem cells (NSCs)12,13. Therefore, to interrogate the significance of the ID2-T27A mutation, we tested the self-renewing capacity of ID2-null NSCs reconstituted with wild type (WT) or ID2-T27A (Fig. 1a). Introduction of ID2-T27A in ID2-null NSCs increased neurosphere formation in serial passages by more than 50% when compared with WT ID2 (p = 0.00883-0.000229; t ratio = 4.772-12.597) and caused a 2.4-fold increase in cell expansion rate (40.5±1.7 vs. 16.7±0.831; p < 0.0001, Fig. 1b-d). From the analysis of 18 candidate kinases, the dual-specificity tyrosine-phosphorylation-regulated protein kinases 1A and 1B (DYRK1A and DYRK1B) emerged as the only enzymes able to phosphorylate T27 of ID2 (Fig. 1e, Extended Data Fig. 2d). The sequence surrounding the T27 residue in ID2 resembles the DYRK1 phosphorylation consensus motif RX(X)(S/T)P and is highly conserved in different species (Extended Data Fig. 2c)14. Antibodies against a phospho-T27-ID2 peptide confirmed that ID2 is phosphorylated by WT but not the inactive DYRK1B-K140R kinase (Fig. 1a, f-h)15. Endogenous and exogenous ID2 and ID2-T27A co-precipitated endogenous DYRK1A and DYRK1B (Fig. 1i, Extended Data Fig. 2e). Treatment of glioma cells with harmine, a small molecule inhibitor of DYRK116, or combined shRNA-mediated silencing of DYRK1A and DYRK1B reduced ID2-T27 phosphorylation (Extended Data Fig. 2f, Fig. 3f).
Figure 1. DYRK1-mediated phosphorylation of ID2 at T27 promotes NSC properties.

a, Reconstitution of NSCs ID2-/- with ID2, ID2-T27A, or the empty vector. b, Microphotographs of representative cultures from neurosphere forming assay. c, Percent neurospheres generated in serial clonal assays. (means of 3 biological replicates ± s.d.; ***: p=0.00883-0.000229 for ID2−/−-ID2-T27A compared with ID2−/−-ID2-WT). d, Cumulative cell number of cultures as in c; (means of 3 biological replicates ± s.d. ***: p=<0.0001 for ID2−/−-ID2-T27A compared with ID2−/−-ID2-WT). e, In vitro kinase assay shows phosphorylation of GST-ID2 proteins by recombinant DYRK1B. f, Phosphorylation of ID2 but not ID2-T27A by DYRK1B in IMR32 cells. g, Phosphorylation of endogenous ID2 by DYRK1A in U87 cells. h, Phosphorylation of endogenous ID2 by DYRK1B but not the kinase inactive GFP-DYRK1B-K140R in U87 cells. i, Binding between endogenous DYRK1A or DYRK1B and ID2. WCL: whole cellular lysate.
Figure 3. The DYRK1-ID2-T27 pathway controls GSCs and HIF2α.
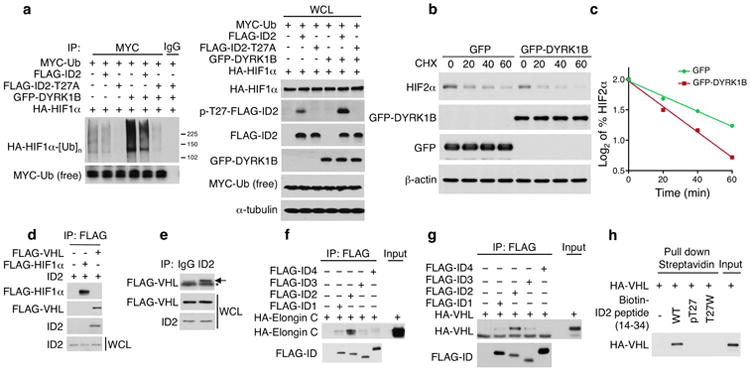
a, Phosphorylation of ID2 but not ID2-T27A by GFP-DYRK1B down-regulates glioma stem cells markers in GSC#31. b, In vitro LDA of parallel cultures shows that decreased frequency of gliomaspheres by DYRK1B is rescued by ID2-T27A. Data are means of 3 biological replicates ± s.d.; **: p = 0.0031 (vector versus DYRK1B); ***: p = 0.00022 (DYRK1B versus DYRK1B plus ID2-T27A). c, Microphotographs of representative cultures in b. d, Serial clonal experiments of cells in b. Data are means of 3 biological replicates ± s.d. of percent gliomaspheres; ***: p=0.00059-0.00007 for vector versus DYRK1B plus vector; ***: p=0.0089-0.0008 for ID2-T27A plus DYRK1B versus DYRK1B plus vector; n.s.: p=0.061-0.249 for ID2-T27A plus DYRK1B versus vector. e, Silencing of DYRK1 down-regulates pT27-ID2 and increases HIF2α in U87 cells. f, Ubiquitylation of HIF2α is enhanced by DYRK1B and reduced by the ID2-T27A as evaluated by in vivo ubiquitylation (left panels, MYC-Ub immunoprecipitation/HA-HIF2α western blot; right panels, whole cell lysates, WCL). g, ID2-T27A elevates HIF2α and counters DYRK1B-mediated reduction of HIF2α during hypoxia. h, ID2-T27A reverts DYRK1B-mediated decrease of HIF2α half-life during recovery from exposure to CoCl2. U87 were exposed to CoCl2 for 3 h followed by CoCl2 washout. i, Quantification of HIF2α protein from the experiment in h.
Next, we sought to identify the regulatory mechanisms controlling ID2-T27 phosphorylation. Exposure of human GBM-derived glioma stem cells (GSCs) to hypoxia or hypoxia-mimicking agent cobalt chloride (CoCl2) caused loss of T27 phosphorylation (Fig. 2a, Extended Data Fig. 3a). Determination of ID2-T27 phosphorylation stoichiometry in the neuronal cell line SK-N-SN revealed that 21.08% of ID2 was phosphorylated on T27 in normoxia but the fraction dropped to 2.28% in hypoxic environment (Extended Data Fig. 3b, c). Mirroring the reduction of ID2-T27 phosphorylation, CoCl2 reduced DYRK1 kinase activity (Fig. 2b, Extended Data Fig. 3d) and DYRK1 auto-phosphorylation, an event required for the activity of DYRK1 kinase17 (Extended Data Fig. 3e-g). Similarly, exposure of GSCs to low oxygen decreased tyrosine DYRK1A and DYRK1B auto-phosphorylation (Fig. 2c, d).
Figure 2. DYRK1 kinases and ID2-T27 phosphorylation are inhibited by hypoxia and regulated by PHD1.
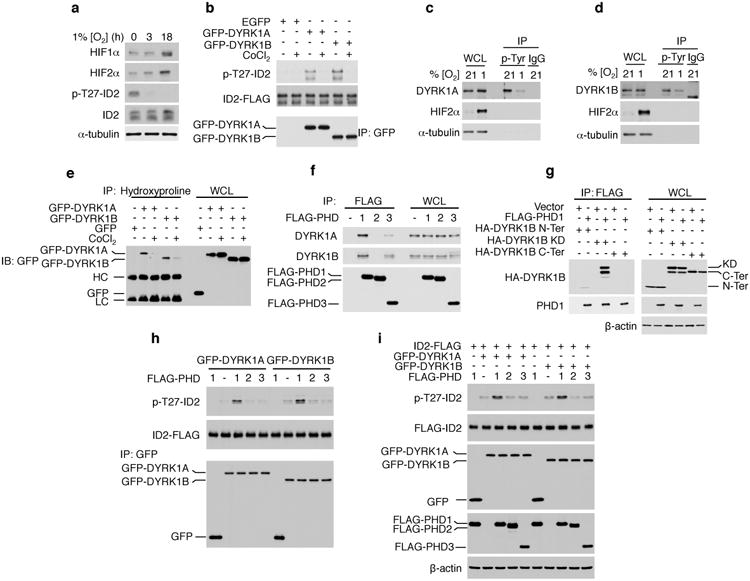
a, Hypoxia inhibits phosphorylation of ID2-T27 in GSC#1123. b, CoCl2 inhibits DYRK1 kinase. GFP-DYRK1 immunoprecipitates from U87 cells untreated or treated with CoCl2 and recombinant ID2-FLAG were used in kinase assay in vitro. c, Hypoxia reduces tyrosine phosphorylation of DYRK1A and d, DYRK1B as evaluated by anti-p-Tyr immunoprecipitation in GSC#1123 cells. e, CoCl2 inhibits proline hydroxylation of DYRK1A and DYRK1B as shown by anti-hydroxyproline immunoprecipitation in U87 glioma cells. (HC, IgG heavy chain; LC, IgG light chain). f, Endogenous DYRK1A and DYRK1B interact with FLAG-PHD1 in U87 cells. g, The kinase domain (KD) but not the N- or the C-terminal domains of DYRK1B interacts with PHD1 in co-immunoprecipitation assay. h, Expression of PHD1 enhances cellular DYRK1 kinase activity in an in vitro phosphorylation assay using recombinant ID2. i, Expression of PHD1 enhances DYRK1 kinase activity towards ID2-T27 in vivo.
Prolyl hydroxylases PHD1, PHD2 and PHD3 operate as direct sensors of cellular oxygen concentration18,19. Immunoprecipitation using an antibody that recognizes hydroxyprolines showed that DYRK1A and DYRK1B carry hydroxylated prolines and CoCl2 abrogated DYRK1 prolyl hydroxylation (Fig. 2e). DYRK1A and DYRK1B interacted in vivo with PHD1 (Fig. 2f) and the expression of PHD1 enhanced prolyl hydroxylation of both kinases (Extended data Fig. 3h). In particular, DYRK1B interacted with PHD1 through the kinase domain (Fig. 2g). The activity of DYRK1A and DYRK1B towards ID2-T27 was potentiated by PHD1 in vitro and in vivo (Fig. 2h, i). Thus, oxygen deprivation induces a constitutively active ID2 by inactivating DYRK1 kinases, which are positively regulated substrates of PHD1.
DYRK1 mediated phosphorylation of ID2 destabilizes HIF2α
We used human GSCs to interrogate the effects of DYRK1 and ID2-T27A on HIF2α and glioma stemness. Lentiviral transduction of the DYRK1-resistant ID2-T27A mutant in GSC#48 resulted in elevation of HIF2α and enhanced tumor sphere forming capacity as measured by limiting dilution assay (LDA, Extended Data Fig. 4a-d). ID2-T27A-induced accumulation of the HIF2α protein was independent of transcription (Extended Data Fig. 4e). When detectable, HIF1α mirrored HIF2α but with more limited changes (Extended Data Fig. 4f).
Expression of DYRK1 in GSC#34 and GSC#31 reduced HIF2α, the HIF2α target TGFα and the glioma stem cell marker SOX2 (Fig. 3a, Extended Data Fig. 4g, h). Also in this case HIF2α mRNA was unchanged (Extended Data Fig. 4h, j). LDA and serial clonal experiments showed that DYRK1-induced decrease of HIF2α attenuated glioma stemness (Fig. 3b-d, Extended Data Fig. 4k). However, accumulation of HIF2α, expression of SOX2 and frequency of GSCs were restored by co-expression of DYRK1 and ID2-T27A but not ID2 WT (Fig. 3a-d, Extended Data Fig. 4k). DYRK1-mediated inhibition of gliomasphere formation was overridden by co-expression of non-degradable HIF2α (HIF2α-TM, Extended Fig. 4l)20. Furthermore, silencing of DYRK1A or DYRK1B up-regulated HIF2α and reduced pT27-ID2, with maximal effects after co-silencing of both kinases (Fig. 3e). Next, we investigated the effects of DYRK1 and ID2-T27A on ubiquitylation and stability of HIFα. DYRK1-mediated phosphorylation of T27 triggered HIFα ubiquitylation and expression of ID2-T27A reverted DYRK1 effect (Fig. 3f, Extended Data Figure 5a). Similarly, expression of DYRK1B prevented accumulation of HIF2α under hypoxia and co-expression of ID2-T27A abrogated this response (Fig. 3g). DYRK1 accelerated the decay of HIF2α during recovery from exposure to CoCl2 and reduced HIF2α half-life and ID2-T27A countered these effects (Fig. 3h, i, Extended Data Figure 5b, c).
ID2 binds and disrupts the VCB-Cul2 complex
Mass spectrometry analysis of ID2 immunoaffinity complexes revealed that Elongin C, a component of the VCB-Cul2 ubiquitin ligase complex that includes VHL, Elongin C, Elongin B, Cullin 2, and RBX1 is an ID2-associated protein (Supplementary Tables 1, 2). The direct interaction of ID2 with Elongin C and VHL was confirmed in vitro and in vivo (Fig. 4a, Extended Data Fig. 5d, e). Conversely, ID2 was unable to bind to HIFα proteins (Extended Data Fig. 5d). VHL and Elongin C interacted strongly with ID2, weakly with ID1 and ID3 and did not bind to ID4 (Fig. 4b, Extended Data Fig. 5f, g). The interaction between ID2 and VHL was mediated by the N-terminal region of ID2 that includes T27 and did not require the HLH domain (amino acids 35-76, Fig. 4c). A more detailed mapping of the regions involved in the VHL-ID2 interaction revealed that amino acids 15-35 of ID2 and the SOCS box of VHL (amino acids 154-174) were required for the binding (Fig. 4d, e). Interestingly, mutation of lysine 159 (K159E), which provides the VHL contact surface for binding to Cul221,22, impaired the interaction with ID2 (Fig. 4e). Consistent with ID2 deletion mapping analysis, an ID2 peptide composed of amino acids 14-34 bound to both VHL and components of the VCB complex pre-assembled in insect cells. However, addition of a phosphate to T27 or mutation of T27 to a bulky hydrophobic amino acid (T27W) prevented the binding to both VHL and the VCB complex (Fig. 4f, Extended Data Fig. 5h). These findings were corroborated by computational molecular docking whereby a N-terminally-derived ID2 peptide (amino acids 15-31) docked preferentially to a groove on the molecular surface of VHL:Elongin C22 with the N-terminal half of its interaction surface contacting the SOCS box of VHL that binds Cul2 (primarily K159) and the C-terminal half (including T27) fitting snugly into a hydrophobic pocket mostly contributed by the Elongin C surface (Extended Data Fig. 6a, c, d). Mutating T27 to phospho-T27 and re-docking resulted in unfavorable energy and displacement of the peptide from this location on the complex (Extended Data Fig. 6b). DYRK1 disrupted the interaction between VHL and WT ID2 but did not affect the binding of VHL to ID2-T27A (Fig. 4g). Conversely, the phosphomimic ID2-T27E mutant failed to bind VHL and did not promote accumulation of HIF2α (Extended Data Fig. 7a, b). Next, we developed an in vitro assay using purified proteins that included bacterially expressed FLAG-ID2, enzymatically active recombinant DYRK1B and baculovirus-expressed VCB-Cul2 complex or purified VHL. In this system, ID2 bound to VCB-Cul2 complex and VHL in the absence of active DYRK1B but the interaction was disrupted by DYRK1-mediated phosphorylation of T27 (Fig. 4h, Extended Data Fig. 7c).
Figure 4. Unphosphorylated ID2 binds to and disrupts the VCB-Cul2 complex.
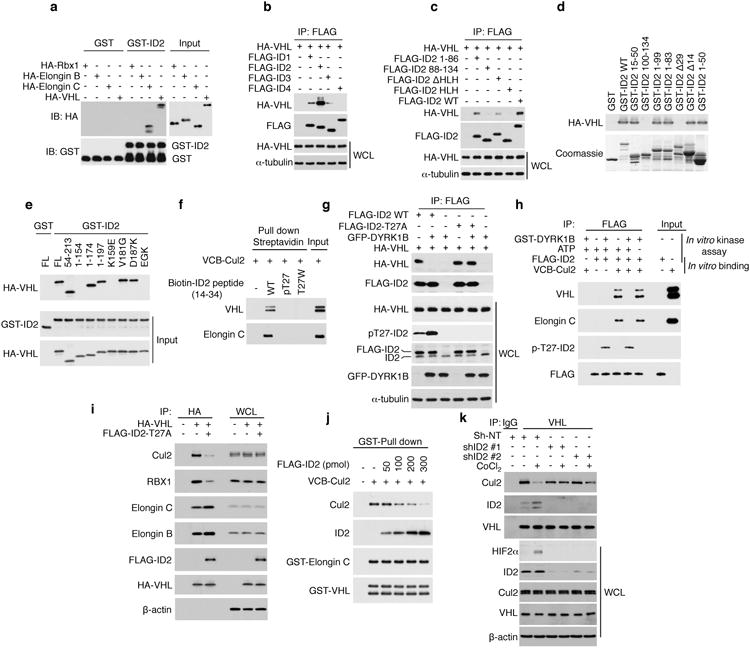
a, Recombinant ID2 interacts with Elongin C and VHL in GST-pull-down assay (input: 10%). b, Co-immunoprecipitation shows that VHL preferentially interacts with ID2. c, The N-terminus of ID2 is required for the interaction with VHL as determined by IP-WB analysis. d, The N-terminus of GST-ID2 is required for the interaction with in vitro translated HA-VHL. e, Amino acids 154-174 of in vitro translated HA-VHL mediate interaction with GST-ID2 (input: 10%). f, Phosphorylation of ID2-T27 or the ID2-T27W mutation disrupt ID2-VHL interaction as analyzed by in vitro streptavidin pull down of biotinylated ID2 peptides in the presence of recombinant VCB-Cul2. g, Co-immunoprecipitation shows that DYRK1B-mediated phosphorylation of ID2 disrupts ID2 interaction with VHL in vivo. h, In vitro phosphorylation of recombinant ID2 by purified DYRK1B blocks ID2 interaction with VHL and Elongin C in reconstituted VCB-Cul2 complex. i, ID2-T27A displaces Cul2 from VCB complex in co-immunoprecipitation assay in U87 cells. j, Progressive dissociation of Cul2 from recombinant VCB complex by increasing concentration of purified FLAG-ID2. k, Silencing of ID2 in U87 reverts CoCl2-mediated dissociation of Cul2 from VHL as evaluated by co-IP/WB. WCL, whole cell lysates.
In the VCB-Cul2 complex the Cul2 subunit provides the scaffold module for the interaction with the ubiquitin-conjugating enzyme (E2)23,24. As we expressed ID2-T27A, ID2 was loaded onto VCB and Cul2/RBX1 module dissociated from the complex in the absence of changes in the total cellular levels of Cul2 and RBX1 (Fig. 4i). We also found that challenging the pre-assembled VCB complex with increasing amounts of recombinant FLAG-ID2 resulted in progressive dissociation of Cul2 (Fig. 4j). Expression of ID2-T27A triggered comparable block of Elongin C-Cul2 association whereas it did not affect the assembly of a Cul5-based complex containing SOCS2, a SOCS protein that cannot bind to ID2-T27A (Extended Data Fig. 7d, e). Finally, in glioma cells in which ID2 and VHL are present at a molar ratio of 5.8:1 (Extended Data Fig. 7f), hypoxia signaling promoted the association between endogenous VHL and ID2 while dissociating Cul2 (Fig. 4k, Extended Data Fig. 7g). Silencing of ID2 rescued the dissociation of Cul2 from VCB complex and prevented HIF2α elevation (Fig. 4k). Together, these findings indicate that ID2 activation stabilizes HIF2α by disabling VCB ubiquitin ligase via dissociation of Cul2.
A DYRK1-ID2 pathway controls HIF2α in glioma
To ask whether activation of ID2 enhances HIF2α transcriptional activity in an unbiased fashion, we used CINDy, an algorithm for high-fidelity reconstruction of post-translational causal dependencies to interrogate whether ID2 can affect the activity of HIF2α on its targets in the context of GBM25. When applied to a collection of 548 TCGA-derived GBM samples, ID2 activity emerged as the modulator of the transcriptional connection between HIF2α and its activated target genes (Fig. 5a, b). The activity of ID2 is estimated by the VIPER algorithm, a computational tool designed to infer protein activity from gene expression data26. When GBM samples were divided into two groups based on ID2 activity, samples with higher ID2 activity showed significantly stronger correlation between HIF2α and its targets than a set of random genes (p=0.001, Fig. 5a). This positive correlation was absent in the cohort of GBM with low ID2 activity (p=0.093, Fig. 5b). Consistent with these observations, we detected a marked reduction of HIF2α protein following acute deletion of the ID2 gene in a mouse model of malignant glioma (Extended Data Fig. 8a)9. We interrogated the effect of DYRK1 expression in mouse models of human glioma. Tetracycline-induced expression of DYRK1B at levels comparable to normal brain (Extended Data Fig. 8b), down-regulated HIF2α in glioma cells in vitro and in sub-cutaneous xenografts and reduced the expression of the HIF2α targets that promote stem cell functions (Fig. 5c-e). Expression of DYRK1B also inhibited tumor cell proliferation in vivo, resulting in tumor reduction (Fig. 5f, Extended Data Fig. 8c, d). Next, we evaluated the antitumor effects of DYRK1B WT or the kinase inactive K140R mutant in an orthotopic model of glioma (Extended Data Fig. 8e). Animals bearing glioma cells that expressed WT DYRK1B manifested significantly increased survival and tumor latency relative to mice bearing DYRK1B-K140R or vector transduced cells (Fig. 5g, h). Two out of seven mice in the DYRK1B WT group developed tumors that failed to express exogenous DYRK1B (Extended Data Fig. 8f). This result suggests that active DYRK1 kinase is incompatible with tumor growth in this glioma model. Finally, higher DYRK1A and DYRK1B predicted a more favorable clinical outcome for GBM patients, thus supporting the clinical significance of DYRK1 activity in glioma (Fig. 5i, Extended Data Fig. 9a).
Figure 5. DYRK1 kinases inhibit human glioma growth by repressing an ID2-HIF2α network.
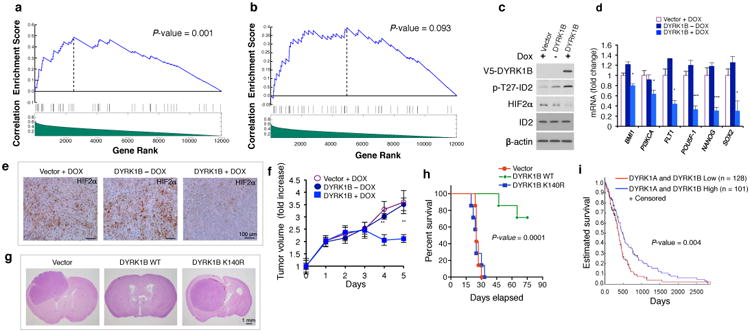
a, Significant and positive targets of HIF2α correlate with HIF2α in GBM with high ID2 activity compared to a set of random genes by GSEA; b, Correlations are not significant in GBM with low ID2 activity c, Inducible expression of DYRK1B in U87 causes ID2-T27 phosphorylation and down-regulation of HIF2α. d, qRT-PCR from cells treated as in c; n=9 (3 biological replicates performed in triplicates) ± s.d. BMI1: *: p = 0.0470; PI3KCA: *: p = 0.0279; FLT1: *: p = 0.0246; POU5F-1: ***: p = 0.000796344; NANOG: ***: p = 0.000737396; SOX2: *: p = 0.028884239 (DYRK1B-DOX versus DYRK1B + DOX). e, Inducible expression of DYRK1B down-regulates HIF2α in subcutaneous xenografts of U87 cells as indicated by immunostaining. f, Inducible expression of DYRK1B causes tumor growth inhibition in mice treated as in e. Doxycycline treatment starts at day 0 (n = 7 mice per group; **: p = 0.0040 and 0.0069, DYRK1B – DOX versus DYRK1B + DOX at day 4 and day 5, respectively). g, Expression of DYRK1B WT but not DYRK1B-K140R inhibits orthotopic growth of U87 (H&E staining of brain cross sections). Mice injected with U87-vector or DYRK1B-K140R were sacrificed on day 25. Mice injected with U87-DYRK1B were sacrificed on day 70. h, Kaplan-Meier analysis of mice in g (n = 7 animals per group). i, Expression of DYRK1A and DYRK1B predicts survival in GBM patients.
Discussion
Here we report a novel mechanism of functional inactivation of the VHL ubiquitin ligase that is independent of genetic mutations of the VHL gene. This mechanism is centered on the ability of active ID2 to disrupt the VCB-Cul2 complex, leading to HIF2α stabilization. We also unravel a hypoxia-directed cascade of events that by overriding the restraining effect of DYRK1-mediated phosphorylation of ID2 on T27, culminates with ID2 activation and HIF2α stabilization. The transcriptional activation of the ID2 gene, a HIFα target27, by HIF2α generates a feed-forward ID2-HIF2α loop that further supports cancer stem cells and glioma aggressiveness (Extended Data Fig. 10). By showing that PHD1-mediated prolyl hydoxylation enhances the enzymatic activity of DYRK1 kinases towards ID2, our findings provide a clue to the mechanism of DYRK1 inhibition in hypoxia. Thus, inhibition of DYRK1 kinases is an oxygen-sensing signal that disables VBC-Cul2. The gene coding for DYRK1A is gained in Down's syndrome, a disease characterized by impaired neural proliferation during development28-30, reduced self-renewal and premature withdrawal from cell cycle31. These findings are consistent with the notion that activation of DYRK1A and DYRK1B inhibits proliferation and activates a cellular quiescence program32-37. It is plausible that DYRK1-activating signals are negative regulators of self-renewal of both normal and cancer stem cells. By phosphorylating ID2 on T27 DYRK1 weakens the core of the stemness machinery centered on the ID2-HIF2α pathway. We suggest that together with the control of ID2 activity, regulation of Sonic Hedgehog/Gli signaling and CREB-mediated transcription by DYRK kinases cooperate to restrain stem cell functions and tumorigenesis in the nervous system38-40. The glioma inhibitory effect of DYRK1 in the mouse and the predictive value of DYRK1 expression on GBM patient survival support the tumor suppressor function of DYRK1 kinases in vivo. Whereas there is consistency for the negative role of DYRK1 towards stemness and cell proliferation31,35, the broad spectrum of DYRK kinase substrates may account for the pro-tumorigenic functions of DYRK1 reported by other studies41. It has been proposed that loss of DYRK1 and accumulation of ID2 and HIF2α drive tumor progression of other cancer types, beside GBM. The mechanism reported here might operate broadly during the transition of cancer cells towards the more aggressive stem-like state that drives maintenance and progression of solid tumors.
Methods
Plasmids, cloning and lentivirus production
A constitutively stabilized mutant of HIF2α (HIF2α-TM) was obtained from Christina Warnecke20. The HIF2α-TM construct harbors the following mutations in the prolyl and asparagyl hydroxylation sites: P405A, P530G, N851A. Polypeptide fragments of DYRK1B were cloned into pcDNA3-HA and include DYRK1B-N-terminus, N-Ter (amino acids 1-110), DYRK1B Kinase Domain, KD (amino acids 111-431), and DYRK1B-C-terminus, C-Ter (amino acids 432-629). cDNAs for RBX1, Elongin B and Elongin C were kindly provided from Michele Pagano (New York University, New York, NY) and cloned into the pcDNA vector by PCR. HA-tagged HIF1α and HIF2α were obtained from Addgene. GFP-tagged DYRK1A and DYRK1B were cloned into pcDNA vector. pcDNA-HA-VHL was kindly provided by Kook Hwan Kim (Sungkyunkwan University School of Medicine, Korea). Site-directed mutagenesis was performed using QuickChangeR or QuickChange Multi Site-Directed mutagenesis kit (Agilent) and resulting plasmids were sequence verified. Lentivirus was generated by co-transfection of the lentiviral vectors with pCMV-ΔR8.1 and pMD2.G plasmids into HEK293T cells as previously described9,42. ShRNA sequences are: ID2-1: GCCTACTGAATGCTGTGTATACTCGAGTATACACAGCATTCAGTAGGC; ID2-2: CCCACTATTGTCAGCCTGCATCTCGAGATGCAGGCTGACAATAGTGGG; DYRK1A: CAGGTTGTAAAGGCATATGATCTCGAGATCATATGCCTTTACAACCTG; DYRK1B: GACCTACAAGCACATCAATGACTCGAGTCATTGATGTGCTTGTAGGTC.
Cell culture and hypoxia induction
IMR-32 (ATCC CCL-127), SK-N-SH (ATCC HTB-11), U87 (ATCC HTB-14), NCI-H1299 (ATCC CRL-5803), HRT18 (ATCC CCL-244), and HEK293T (ATCC CRL-11268) cell lines were acquired through American Type Culture Collection. U251 (Sigma, #09063001) cell line was obtained through Sigma. Cell lines cultured in DMEM supplemented with 10% fetal bovine serum (FBS, Sigma). Cells were routinely tested for mycoplasma contamination using Mycoplasma Plus PCR Primer Set (Agilent, Santa Clara, CA) and were found to be negative. Cells were transfected with Lipofectamine 2000 (Invitrogen) or Calcium phosphate. Mouse NSCs were grown in Neurocult medium (Stemcell Technologies) containing 1× proliferation supplements (Stemcell Technologies), and recombinant FGF-2 and EGF (20 ng/ml each; Peprotech). GBM-derived glioma initiating cells were obtained by de-identified brain tumor specimens from excess material collected for clinical purposes at New York Presbyterian-Columbia University Medical Center. Donors (patients diagnosed with glioblastoma) were anonymous. Progressive numbers were used to label specimens coded in order to preserve the confidentiality of the subjects. Work with these materials was designated as IRB exempt under paragraph 4 and it is covered under IRB protocol #IRB-AAAI7305. GBM-derived GSCs were grown in DMEM:F12 containing 1× N2 and B27 supplements (Invitrogen) and human recombinant FGF-2 and EGF (20 ng/ml each; Peprotech). Cells at passage (P) 4 were transduced using lentiviral particle in medium containing 4 μg/ml of polybrene (Sigma). Cells were cultured in hypoxic chamber with 1% O2 (O2 Control Glove Box, Coy Laboratory Products, MI) for the indicated times or treated with a final concentration of 100-300 μM of CoCl2 (Sigma) as specified in figure legends.
Mouse neurosphere assay was performed by plating 2,000 cells in 35 mm dishes in collagen containing NSC medium to ensure that distinct colonies were derived from single cells and therefore clonal in origin43. We determined neurosphere formation over serial clonal passages in limiting dilution semi-solid cultures and the cell expansion rate over passages, which is considered a direct indication of self-renewing symmetric cell divisions44. For serial sub-culturing we mechanically dissociated neurospheres into single cells in bulk and re-cultured them under the same conditions for six passages. The number of spheres was scored after 14 days. Only colonies >100 μm in diameter were counted as spheres. Neurosphere size was determined by measuring the diameters of individual neurospheres under light microscopy. Data are presented as percent of neurospheres obtained at each passage (number of neurospheres scored/number of NSCs plated × 100) in three independent experiments. p-value was calculated using a multiple t test with Holm-Sidak correction for multiple comparisons. To determine the expansion rate, we plated 10,000 cells from 3 independent P1 clonal assays in 35 mm dishes and scored the number of viable cells after 7 days by Trypan Blue exclusion. Expansion rate of NSCs was determined using a linear regression model and difference in the slopes (p-value) was determined by the analysis of covariance (ANCOVA) using Prism 6.0 (GraphPad Inc.). Limiting dilution assay for human GSCs was performed as described previously45. Briefly, spheres were dissociated into single cells and plated into 96-well plates in 0.2 ml of medium containing growth factors at increasing densities (1-100 cells/well) in triplicate. Cultures were left undisturbed for 14 days, and then the percentage of wells not containing spheres for each cell dilution was calculated and plotted against the number of cells per well. Linear regression lines were plotted, and we estimated the minimal frequency of glioma cells endowed with stem cell capacity (the number of cells required to generate at least one sphere in every well = the stem cell frequency) based on the Poisson distribution and the intersection at the 37% level using Prism 6.0 software. Data represent the means of three independent experiments performed in different days for the evaluation of the effects of ID2, ID2-T27A in the presence or in the absence of DYRK1B. LDA for the undegradable HIF2α rescue experiment was performed by using three cultures transduced independently on the same day.
Identification of phosphorylation sites of ID2
To identify the sites of ID2 phosphorylation from IMR32 human neuroblastoma cells, the immunoprecipitated ID2 protein was excised, digested with trypsin, chymotrypsin and Lys-C and the peptides extracted from the polyacrylamide in two 30 μl aliquots of 50% acetonitrile/5% formic acid. These extracts were combined and evaporated to 25 μl for MS analysis. The LC-MS system consisted of a state-of-the-art Finnigan LTQ-FT mass spectrometer system with a Protana nanospray ion source interfaced to a self-packed 8 cm × 75 mm id Phenomenex Jupiter 10 μm C18 reversed-phase capillary column. 0.5-5 μl volumes of the extract were injected and the peptides eluted from the column by an acetonitrile/0.1 M acetic acid gradient at a flow rate of 0.25 μl/min. The nanospray ion source was operated at 2.8 kV. The digest was analyzed using the double play capability of the instrument acquiring full scan mass spectra to determine peptide molecular weights and product ion spectra to determine amino acid sequence in sequential scans. This mode of analysis produces approximately 1200 CAD spectra of ions ranging in abundance over several orders of magnitude. Tandem MS/MS experiments were performed on each candidate phosphopeptide to verify its sequence and locate the phosphorylation site. A signature of a phosphopeptide is the detection of loss of 98 daltons (the mass of phosphoric acid) in the MS/MS spectrum. With this method, three phosphopeptides were found to carry phosphorylations at residues Serine-5, Serine-14 and Threonine-27 of the ID2 protein.
Generation of phospho-ID2-T27 antibody
The anti-phospho-T27-ID2 antibody was generated by immunizing rabbits with a short synthetic peptide containing the phosphorylated T27 (CGISRSK-pT-PVDDPMS) (Yenzym Antibodies, LLC). A two-step purification process was applied. First, antiserum was cross-absorbed against the phospho-peptide matrix to purify antibodies that recognize the phosphorylated peptide. Then, the anti-serum was purified against the un-phosphorylated peptide matrix to remove non-specific antibodies.
Immunoblot, immunoprecipitation and in vitro binding assay
Cells were lysed in NP40 lysis buffer [50 mM Tris-HCl, pH 7.5, 150 mM NaCl, 1 mM EDTA, 1% NP40, 1.5 mM Na3VO4, 50 mM sodium fluoride, 10 mM sodium pyrophosphate, 10 mM β-glycerolphosphate and EDTA free protease inhibitor cocktail (Roche)] or RIPA buffer [50 mM Tris-HCl, pH 7.5, 150 mM NaCl, 1 mM EDTA, 1% NP40, 0.5% Sodium Dexoycholate, 0.1% Sodium dodecyl sulfate, 1.5 mM Na3VO4, 50 mM sodium fluoride, 10 mM sodium pyrophosphate, 10 mM β-glycerolphosphate and EDTA free protease inhibitor cocktail (Roche)]. Lysates were cleared by centrifugation at 15,000 rpm for 15 min at 4°C. For immunoprecipitation, cell lysates were incubated with primary antibody (hydroxyproline, Abcam, ab37067; VHL, BD, 556347; DYRK1A, Cell Signaling Technology, #2771; DYRK1B, Cell Signaling Technology, #5672) and protein G/A beads (Santa Cruz, sc-2003) or phospho-Tyrosine (P-Tyr-100) Sepharose beads (Cell Signaling Technology #9419), HA affinity matrix (Roche, 11815016001), FLAG M2 affinity gel (Sigma, F2426) at 4°C overnight. Beads were washed with lysis buffer four times and eluted in 2× SDS sample buffer. Protein samples were separated by SDS-PAGE and transferred to polyvinyl difluoride (PVDF) or nitrocellulose (NC) membrane. Membranes were blocked in TBS with 5% non-fat milk and 0.1% Tween20, and probed with primary antibodies. Antibodies and working concentrations are: ID2 1:500 (C-20, sc-489), GFP 1:1000 (B-2, sc-9996), HIF2α/EPAS-1 1:250 (190b, sc-13596), c-MYC (9E10, sc-40), and Elongin B 1:1000 (FL-118, sc-11447), obtained from Santa Cruz Biotechnology; phospho-Tyrosine 1:1000 (P-Tyr-100, #9411), HA 1:1000 (C29F4, #3724), VHL 1:500 (#2738), DYRK1A 1:1000, #2771; DYRK1B 1:1000, #5672) and RBX1 1:2000 (D3J5I, #11922), obtained from Cell Signaling Technology; VHL 1:500 (GeneTex, GTX101087); β-actin 1:8000 (#A5441), α-tubulin 1:8000 (#T5168), and FLAG M2 1:500 (#F1804) obtained from Sigma; HIF1α 1:500 (H1alpha67, NB100-105) and Elongin C 1:1000 (NB100-78353) obtained from Novus Biologicals; HA 1:1000 (3F10, #12158167001) obtained from Roche. Secondary antibodies horseradish-peroxidase-conjugated were purchased from Pierce and ECL solution (Amersham) was used for detection.
For in vitro binding assays, HA-tagged RBX1, Elongin B, Elongin C and VHL were in vitro translated using TNT quick coupled transcription/translation system (Promega). Active VHL protein complex was purchased from EMD Millipore. Purified His-VHL protein was purchased from ProteinOne (Rockville, MD). GST and GST-ID2 proteins were bacterial expressed and purified using glutathione sepharose beads (GE healthcare life science). Active DYRK1B (Invitrogen) was used for in vitro phosphorylation of ID2-FLAG proteins. Biotinylated WT and modified (pT27 and T27W) ID2 peptides (amino acids 14-34) were synthesized by LifeTein (Somerset, NJ). In vitro binding experiments between ID2 and VCB-Cul2 were performed using 500 ng of ID2-FLAG and 500 ng of VCB-Cul2 complex or 500 ng VHL protein in binding buffer [50 mM Tris-Cl, pH 7.5, 100 mM NaCl, 1 mM EDTA, 10 mM β -glycerophosphate, 10 mM Sodium pyrophosphate, 50 mM Sodium fluoride, 1.5 mM Na3VO4, 0.2% NP40, 10% glycerol, 0.1 mg/ml BSA and EDTA free protease inhibitor cocktail (Roche)] at 4°C for 3 h. In vitro binding between ID2 peptides and purified proteins was performed using 2 μg of ID2 peptides and 200 ng of recombinant VCB-Cul2 complex or 200 ng recombinant VHL in binding buffer [50 mM Tris-Cl, pH 7.5, 100 mM NaCl, 1 mM EDTA, 10 mM β-glycerophosphate, 10 mM Sodium pyrophosphate, 50 mM Sodium fluoride, 1.5 mM Na3VO4, 0.4% NP40, 10% glycerol, 0.1 mg/ml BSA and EDTA free protease inhibitor cocktail (Roche)] at 4°C for 3 h or overnight. Protein complexes were pulled down using glutathione sepharose beads (GE Healthcare Life Science) or streptavidin conjugated beads (Thermo Fisher Scientific) and analyzed by immunoblot.
In vitro and in vivo kinase assays
Cdk1, Cdk5, DYRK1A, DYRK1B, ERK, GSK3, PKA, CaMKII, Chk1, Chk2, RSK-1, RSK-2, Aurora-A, Aurora-B, PLK-1, PLK-2, and NEK2 were all purchased from Life Technology and ATM from EMD Millipore. The 18 protein kinases tested in the survey were selected because they are proline-directed S/T kinases (Cdk1, Cdk5, DYRK1A, DYRK1B, ERK) and/or because they were considered to be candidate kinases for T27, S14 or S5 from kinase consensus prediction algorithms (NetPhosK1.0, http://www.cbs.dtu.dk/services/NetPhosK/; GPS Version 3.0 http://gps.biocuckoo.org/#) or visual inspection of the flanking regions and review of the literature for consensus kinase phosphorylation motifs. 1 μg of bacterially purified GST-ID substrates were incubated with 10-20 ng each of the recombinant active kinases. The reaction mixture included 10 μCi of [γ-32P]ATP (PerkinElmer Life Sciences) in 50 μl of kinase buffer (25 mM Tris-HCl, pH 7.5, 5 mM β-glycerophosphate, 2 mM dithiothreitol (DTT), 0.1 mM Na3VO4, 10 mM MgCl2, and 0.2 mM ATP). Reactions were incubated at 30°C for 30 min. Reactions were terminated by addition of Laemmli SDS sample buffer and boiling on 95°C for 5 min. Proteins were separated on SDS-PAGE gel and phosphorylation of proteins was visualized by autoradiography. Coomassie staining was used to document the amount of substrates included in the kinase reaction. In vitro phosphorylation of ID2-FLAG proteins by DYRK1B (Invitrogen) was performed using 500 ng of GST-DYRK1B and 200 ng of bacterially expressed purified ID2-FLAG protein.
In vivo kinase assay in GSCs and glioma cells was performed using endogenous or exogenously expressed DYRK1A and DYRK1B. Cell lysates were prepared in lysis buffer [50 mM Tris-HCl, pH 7.5, 150 mM NaCl, 1 mM EDTA, 1% NP40, 1.5 mM Na3VO4, 50 mM sodium fluoride, 10 mM sodium pyrophosphate, 10 mM β-glycerolphosphate and EDTA free protease inhibitor cocktail (Roche)]. DYRK1 kinases were immunoprecipitated using DYRK1A and DYRK1B antibodies (for endogenous DYRK1 proteins) or GFP antibody (for exogenous GFP-DYRK1 proteins) from 1 mg cellular lysates at 4°C. Immunoprecipitates were washed with lysis buffer four times followed by two washes in kinase buffer as described above and incubated with 200 ng purified ID2-FLAG protein in kinase buffer for 30 min at 30°C. Kinase reactions were separated by SDS-PAGE and analyzed by western blot using p-T27-ID2 antibody.
Protein half-life and stoichiometry
HIF2α half-life was quantified using ImageJ processing software (NIH). Densitometry values were analyzed by Prism 6.0 using the linear regression function. Stoichiometric quantification of ID2 and VHL in U87 cells was obtained using recombinant ID2-FLAG and His-tagged-VHL as references. The chemiluminescent signal of serial dilutions of the recombinant proteins was quantified using ImageJ, plotted to generate a linear standard curve against which the densitometric signal generated by serial dilutions of cellular lysates (1×10⁶ U87 cells) was calculated. Triplicate values±SEM were used to estimate the ID2:VHL ratio/cell. The stoichiometry of pT27-ID2 phosphorylation was determined as described46. Briefly, SK-N-SH cells were plated at density of 1×10⁶ in 100 mm dishes. Forty-eight h later 1.5 mg of cellular lysates from cells untreated or treated with CoCl2 during the previous 24 h were prepared in RIPA buffer and immunoprecipitated using 4 μg of pT27-ID2 antibody or rabbit IgG overnight at 4°C. Immune complexes were collected with TrueBlot anti-rabbit IgG beads (Rockland), washed 5 times in lysis buffer, and eluted in SDS sample buffer. Serial dilutions of cellular lysates, IgG and pT27-ID2 immunoprecipitates were loaded as duplicate series for SDS-PAGE/western blot analysis using ID2 or p-T27-ID2 antibodies. Densitometry quantification of the chemiluminescent signals was used to determine i) the efficiency of the immunoprecipitation using the antibody against p-ID2-T27 and ii) the ratio between efficiency of the immunoprecipitation evaluated by western blot for p-T27-ID2 and total ID2 antibodies. This represents the percent of phosphorylated T27-ID2 present in the cell preparation.
Identification of ID2 complexes by mass spectrometry
Cellular ID2 complexes were purified from the cell line NCI-H1299 stably engineered to express FLAG-HA-ID2. Cellular lysates were prepared in 50 mM Tris-HCl, 250 mM NaCl, 0.2% NP40, 1 mM EDTA, 10% glycerol, protease and phosphatase inhibitors. FLAG-HA-ID2 immunoprecipitates were recovered first with anti-FLAG antibody-conjugated M2 agarose (Sigma) and washed with lysis buffer containing 300 mM NaCl and 0.3% NP40. Bound polypeptides were eluted with FLAG peptide and further affinity purified by anti-HA antibody-conjugated agarose (Roche). The eluates from the HA beads were analyzed directly on long gradient reverse phase LC-MS/MS. A specificity score of proteins interacting with ID2 was computed for each polypeptide by comparing the number of peptides identified from our mass spectrometry analysis to those reported in the CRAPome database that includes a list of potential contaminants from affinity purification-mass spectrometry experiments (www.crapome.org). The specificity score is computed as [(#peptide*#xcorr)/(AveSC*MaxSC* # of Expt.)], #peptide, identified peptide count; #xcorr, the cross-correlation score for all candidate peptides queried from the database; AveSC, averaged spectral counts from CRAPome; MaxSC, maximal spectral counts from CRAPome; and # of Expt., the total found number of experiments from CRAPome.
Ubiquitylation assay
U87 cells were transfected with pcDNA3-HA-HIFα (HIF1α or HIF2α), pcDNA3-ID2-FLAG (WT or T27A), pEGFP-DYRK1B and pcDNA3-Myc-Ubiquitin. 36 h after transfection, cells were treated with 20 μM MG132 (EMD Millipore) for 6 h. After washing with ice-cold PBS twice, cells were lysed in 100 μl of 50 mM Tris-HCl pH 8.0, 150 mM NaCl (TBS) containing 2% SDS and boiled at 100°C for 10 min. Lysates were diluted with 900 μl of TBS containing 1% NP40. Immunoprecipitation was performed using 1 mg of cellular lysates. Ubiquitylated proteins were immunoprecipitated using anti-Myc antibody and analyzed by western blot using HA antibody.
Docking of ID2 peptide to the VCB complex
A previously described47, highly accurate flexible peptide docking method implemented in ICM software (Molsoft LLC, La Jolla CA) was used to dock ID2 peptides to VCB or components thereof. A series of overlapping peptides of varying lengths were docked to the complex of VHL and Elongin C (EloC), or VHL or EloC alone, from the recent crystallographic structure22 of the VHL-CRL ligase. Briefly, an all-atom model of the peptide was docked into grid potentials derived from the X-ray structure using a stochastic global optimization in internal coordinates with pseudo-Brownian and collective “probability-biased” random moves as implemented in the ICM program. Five types of potentials for the peptide-receptor interaction energy – hydrogen van der Waals, non-hydrogen van der Waals, hydrogen bonding, hydrophobicity and electrostatics – were precomputed on a rectilinear grid with 0.5 Å spacing that fills a 34 Å × 34 Å × 25 Å box containing the VHL-EloC (V-C) complex, to which the peptide was docked by searching its full conformational space within the space of the grid potentials. The preferred docking conformation was identified by the lowest energy conformation in the search. The preferred peptide was identified by its maximal contact surface area with the respective receptor.
ab initio folding and analysis of the peptides was performed as previously described48,49. ab initio folding of the ID2 peptide and its phospho-T27 mutant showed that both strongly prefer an α-helical conformation free (unbound) in solution, with the phospho-T27 mutant having a calculated free energy almost 50 kcal-equivalent units lower than the unmodified peptide.
RT-PCR
Total RNA was prepared with Trizol reagent (Invitrogen) and cDNA was synthesized using SuperScript II Reverse Transcriptase (Invitrogen) as described42,50. Semi-quantitative RT-PCR was performed using AccuPrime Taq DNA Polymerase (Invitrogen) and the following primers: for HIF2A Fw 5′_GTGCTCCCACGGCCTGTA_3′ and Rv 5′_TTGTCACACCTATGGCATATCACA_3′; GAPDH Fw 5′_AGAAGGCTGGGGCTCATTTG_3′ and Rv 5′_AGGGGCCATCCACAGTCTTC_3′. The quantitative RT-PCR was performed with a Roche480 thermal cycler, using SYBR Green PCR Master Mix from Applied Biosystem. Primers used in qRT-PCR are: SOX2 Fw 5′_TTGCTGCCTCTTTAAGACTAGGA_3′ and Rv 5′_CTGGGGCTCAAACTTCTCTC_3′; NANOG Fw 5′_ATGCCTCACACGGAGACTGT_3′ and Rv 5′_AAGTGGGTTGTTTGCCTTTG_3′; POU5F1 Fw 5′_GTGGAGGAAGCTGACAACAA_3′ and Rv 5′_ATTCTCCAGGTTGCCTCTCA_3′; FLT1 Fw 5′_AGCCCATAAATGGTCTTTGC_3′ and Rv 5′_GTGGTTTGCTTGAGCTGTGT_3′; PIK3CA Fw 5′_TGCAAAGAATCAGAACAATGCC_3′ and 5′_CACGGAGGCATTCTAAAGTCA_3′; BMI1 Fw 5′_AATCCCCACCTGATGTGTGT_3′ and Rv 5′_GCTGGTCTCCAGGTAACGAA_3′; GAPDH Fw 5′_GAAGGTGAAGGTCGGAGTCAAC_3′ and Rv 5′_CAGAGTTAAAAGCAGCCCTGGT_3′; 18S Fw 5′_CGCCGCTAGAGGTGAAATTC_3′ and Rv 5′_CTTTCGCTCTGGTCCGTCTT_3′. The relative amount of specific mRNA was normalized to 18S or GAPDH. Results are presented as the mean±SD of three independent experiments each performed in triplicate (n=9). Statistical significance was determined by Student's t test (two-tailed) using GraphPad Prism 6.0 software.
Subcutaneous and intracranial xenograft glioma models
Mice were housed in pathogen-free animal facility. All animal studies were approved by the IACUC at Columbia University (#AAAE9252; AAAE9956). Mice were 4-6 week old male athymic nude (Nu/Nu, Charles River Laboratories). No statistical method was used to predetermine sample size. No method of randomization was used to allocate animals to experimental groups. Mice in the same cage were generally part of the same treatment. The investigators were not blinded during outcome assessment. In none of the experiments did tumors exceed the maximum volume allowed according to our IACUC protocol, specifically 20 mm in the maximum diameter. 2×10⁵ U87 cells stably expressing a doxycycline inducible lentiviral vector coding for DYRK1B or the empty vector were injected subcutaneously in the right flank in 100 μl volume of saline solution (7 mice per each group). Mice carrying 150-220 mm3 subcutaneous tumors (21 days from injection) generated by cells transduced with DYRK1B were treated with vehicle or Doxycycline by oral gavage (Vibramycin, Pfizer Labs; 8 mg/ml, 0.2 ml/die)51; mice carrying tumors generated by cells transduced with the empty vector were also fed with Doxycycline. Tumor diameters were measured daily with caliper and tumor volumes estimated using the formula: width2 × length/2 = V (mm3). Mice were euthanized after 5 days of doxycycline treatment. Tumors were dissected and fixed in formalin for immunohistochemical analysis. Data are means ± s.d. of 7 mice in each group. Statistical significance was determined by the analysis of covariance (ANCOVA) using GraphPad Prism 6.0 software package (GraphPad Inc.).
Orthotopic implantation of glioma cells was performed as described previously using 5×10⁴ U87 cells transduced with pLOC-vector, pLOC-DYRK1B WT or pLOC-DYRK1B-K140R mutant cells in 2 μl phosphate buffer42. In brief, 5 days after lentiviral infection, cells were injected 2 mm lateral and 0.5 mm anterior to the bregma, 2.5 mm below the skull of 4-6 week old athymic nude (Nu/Nu, Charles River Laboratories) mice. Mice were monitored daily for abnormal ill effects according to AAALAS guidelines and euthanized when neurological symptoms were observed. Tumors were dissected and fixed in formalin for immunohistochemical analysis and immunofluorescence using V5 antibody (Life technologies, 46-0705) to identify exogenous DYRK1B and an antibody against human vimentin (Sigma, V6630) to identify human glioma cells. A Kaplan-Meier survival curve was generated using the GraphPad Prism 6.0 software package (GraphPad Inc.). Points on the curves indicate glioma related deaths (n = 7 animals for each group, p was determined by log rank analysis). We did not observe non-glioma related deaths. Mice injected with U87 cells transduced with pLOC-DYRK1B WT that did not show neurological signs on day 70 were sacrificed for histological evaluation and shown as tumor free mice in Fig. 5g.
Immunohistochemistry and immunofluorescence
Tissue preparation and immunohistochemistry on tumor xenografts were performed as previously described42,50,52. Antibodies used in immunostaining are: HIF2α, mouse monoclonal, 1:200 (Novus Biological, NB100-132); Olig2, rabbit polyclonal, 1:200 (IBL International, JP18953); human Vimentin 1:50 (Sigma, V6630), Bromodeoxyuridine, mouse monoclonal 1:500 (Roche, 11170376001), V5 1:500 (Life technologies, 46-0705). Sections were permeabilized in 0.2% tritonX-100 for 10 min, blocked with 1% BSA-5% goat serum in PBS for 1 h. Primary antibodies were incubated at 4°C overnight. Secondary antibodies biotinylated (Vector Laboratories) or conjugated with Alexa 594 (1:500, Molecular Probes) were used. Slides were counterstained with haematoxylin for immunohistochemistry and DNA was counterstained with DAPI (Sigma) for immunofluorescence. Images were acquired using an Olympus 1×70 microscope equipped with digital camera and processed using Adobe Photoshop CS6 software. BrdU-positive cells were quantified by scoring the number of positive cells in five 40 mm2 images from 5 different mice from each group. Blinding was applied during histological analysis. Data are presented as means of five different mice ± standard deviation (s.d.) (two-tailed Student's t test, unequal variance).
Computational analysis of dependency of the HIF2α regulon on ID2 activity
To infer if ID2 modulates the interactions between HIF2α and its transcriptional targets we used a modified version of MINDy53 algorithm, called CINDy25. CINDy uses adaptive partitioning method to accurately estimate the full conditional mutual information between a transcription factor and a target gene given the expression or activity of a signaling protein. Briefly, for every pair of transcription factor and target gene of interest, it estimates the mutual information i.e. how much information can be inferred about the target gene when the expression of the transcription factor is known, conditioned on the expression/activity of the signaling protein. It estimates this conditional mutual information by estimating the multidimensional probability densities after partitioning the sample distribution using adaptive partitioning method. We applied CINDy algorithm on gene expression data for 548 samples obtained from The Cancer Genome Atlas (TCGA). Since the activity level and not the gene expression of ID2 is the determinant of its modulatory function i.e. the extent to which it modulates the transcriptional network of HIF2α, we used an algorithm called Virtual Inference of Protein-activity by Enriched Regulon analysis (VIPER) to infer the activity of ID2 protein from its gene expression profile26. VIPER method allows the computational inference of protein activity, on an individual sample basis, from gene expression profile data. It uses the expression of genes that are most directly regulated by a given protein, such as the targets of a transcription factor (TF), as an accurate reporter of its activity. We defined the targets of ID2 by running ARACNe algorithm on 548 gene expression profiles and use the inferred 106 targets to determine its activity (Supplementary Table 3).
We applied CINDy on 277 targets of HIF2α represented in Ingenuity pathway analysis (IPA) and for which gene expression data was available (Supplementary Table 4). Of these 277 targets, 77 are significantly modulated by ID2 activity (p-value ≤ 0.05). Among the set of target genes whose expression was significantly positively correlated (p-value ≤ 0.05) with the expression of HIF2α irrespective of the activity of ID2, i.e. correlation was significant for samples with both high and low activity of ID2, the average expression of target genes for a given expression of HIF2α was higher when the activity of ID2 was high. The same set of target gene were more correlated in high ID2 activity samples compared to any set of random genes of same size (Fig. 5a), whereas they were not in ID2 low activity samples (Fig. 5b). We selected 25% of all samples with the highest/lowest ID2 activity to calculate the correlation between HIF2α and its targets.
To determine whether regulation of ID2 by hypoxia might impact the correlation between high ID2 activity and HIF2α shown in Fig. 5a, b we compared the effects of ID2 activity versus ID2 expression for the transcriptional connection between HIF2α and its targets. We selected 25% of all patients (n=548) in TCGA with high ID2 activity and 25% of patients with low ID2 activity and tested the enrichment of significantly positively correlated targets of HIF2α in each of the groups. This resulted in significant enrichment (p-value < 0.001) in high ID2 activity but showed no significant enrichment (p-value = 0.093) in low ID2 activity samples. Moreover, the difference in the enrichment score (ΔES) in these two groups was statistically significant (p-value < 0.05). This significance is calculated by randomly selecting the same number of genes as the positively correlated targets of HIF2α, and calculating the ΔES for these randomly selected genes, giving ΔESrand. We repeated this step 1000 times to obtain 1000 ΔESrand that are used to build the null distribution (Extended Data Fig. 9b). We used the null distribution to estimate p-value calculated as (# ΔES > ΔESrand)/1000. Enrichment was observed only when ID2 activity was high but not when ID2 activity was low, thus suggesting that ID2 activity directionally impacts the regulation of targets of HIF2α by HIF2α. Consistently, the significant ΔES using ID2 activity suggests that ID2 activity is determinant of correlation between HIF2α and its targets.
Conversely, when we performed similar analysis using ID2 expression instead of ID2 activity, we found significant enrichment of positively correlated targets of HIF2α both in samples with high expression (p-value=0.025) and low expression of ID2 (p-value=0.048). Given the significant enrichment in both groups, we did not observe any significant difference in the enrichment score in the two groups (p-value of ΔES = 0.338). Thus, while the determination of the ID2 activity and its effects upon the HIF2α-targets connection by VIPER and CINDy allowed us to determine the unidirectional positive link between high ID2 activity and HIF2α transcription, a similar analysis performed using ID2 expression contemplates the dual connection between ID2 and HIF2α.
Kaplan Meier analysis for DYRK1A and DYRK1B in human GBM
To test if expression of DYRK1A and DYRK1B are predictor of prognosis, we divided the patients into two cohorts based on their relative expression compared to the mean expression of all patients in GBM. First cohort contained the patients with high expression of both DYRK1A and DYRK1B (n=101) and the other cohort contained patients with low expression (n=128). We used average expression for both DYRK1A and DYRK1B, which individually divide the patient cohort into half and half. However, when we use the condition that patients should display higher or lower average expression of both these genes, then we select approximately 19% for high expression and 24% for low expression. Selection of these patients was entirely dependent on the overall expression of these genes in the entire cohort rather than a predefined cutoff. Kaplan Meier survival analysis showed the significant survival benefit for the patients having the high expression of both DYRK1A and DYRK1B (p-value = 0.004) compared to the patients with low expression. When similar analysis was performed using only the expression of DYRK1A or DYRK1B alone, the prediction was either nonsignificant (DYRK1A) or less significant (DYRK1B, p-value = 0.008) when compared to the predictions using the expression of both genes.
Statistics
Results in graphs are expressed as means ± s.d. or means ± sem, as indicated in figure legends, for the indicated number of observations. Statistical significance was determined by the Student's t-test (two-tailed, unequal variance). p-value < 0.05 is considered significant and is indicated in figure legends.
Extended Data
Extended Data Figure 1. ID2 is phosphorylated on Serine-5, Serine-14 and Threonine-27.

Chromatographic results of mass spectrometry analysis of ID2 protein immunoprecipitated from IMR32 human neuroblastoma cells. a, The peptide identified as ID2 A3-R8 shows phosphorylation of Serine-5. b, The peptide identified as ID2 K12-R24 shows phosphorylation of Serine-14. c, The peptide identified as ID2 S25-L36 shows phosphorylation of Threonine-27.
Extended Data Figure 2. T27A missense mutation in ID2 in human cancer cells and ID2-T27 phosphorylation by DYRK1 kinases.
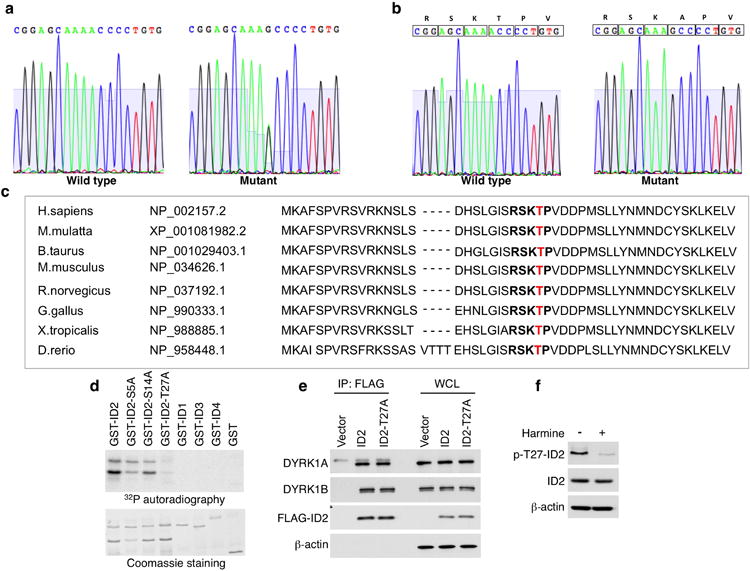
a, Sequence analysis of genomic DNA from the neuroblastoma cell line IMR32 shows the wild type sequence (left panel). Sequencing of DNA from the colon cancer cell line HRT-18 shows a heterozygous mutation resulting in the change of codon-27 from ACC (threonine) to GCC (alanine) (right panel). b, Both wild type and mutant ID2 are expressed in HRT-18 colon cancer cells. Sequence analysis of representative clones (out of 20 clones) derived from HRT-18 cDNA demonstrates expression of wild type (left panel) and mutant (right panel) alleles. c, Amino acid sequence flanking ID2-T27 (marked in red), including the DYRK1 consensus motif (bold), is evolutionarily conserved. d, In vitro kinase assay using bacterially expressed GST-ID proteins and recombinant DYRK1A. e, U87 cells transfected with FLAG-ID2, FLAG-ID2-T27A or the empty vector were immunoprecipitated with FLAG antibody. Co-precipitated proteins were analyzed by western blot using DYRK1A, DYRK1B and FLAG antibodies. β-actin was used as control for loading. WCL, whole cell lysate. f, U87 stably transfected with FLAG-ID2 were treated with harmine (10 μM) or vehicle for 24 h and analyzed by western blot using the indicated antibodies.
Extended Data Figure 3. DYRK1 kinase activity and ID2-T27 phosphorylation are inhibited by hypoxia.
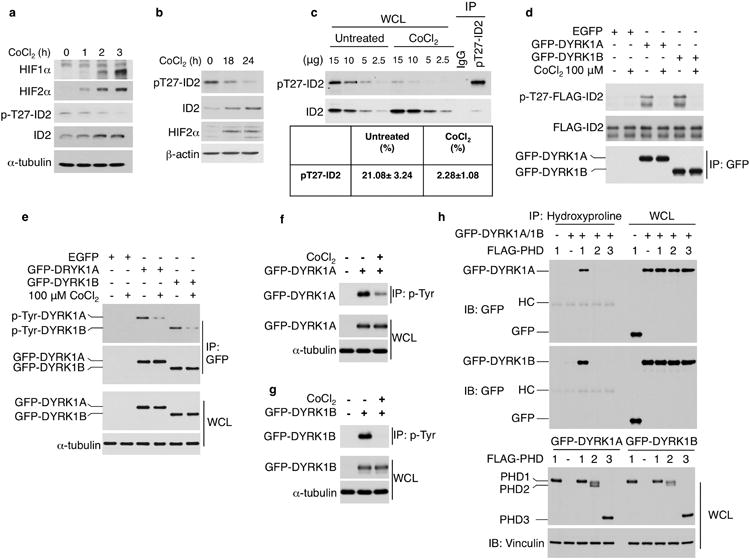
a, U87 glioma cells were treated with 100 μM CoCl2 for the indicated times. Cellular lysates were analyzed by western blot using the indicated antibodies. b, SK-N-SH cells were treated with 300 μM CoCl2 for the indicated times and assayed by western blot using the indicated antibodies. c, Stoichiometric evaluation of pT27-ID2 in SK-N-SH cells untreated or treated with CoCl2 for 24 h. Cellular lysates prepared in denaturing buffer were immunoprecipitated using pT27-ID2 antibody or normal rabbit IgG. Aliquots of whole cell lysates (WCL, μg) and immunoprecipitates were assayed by western blot using pT27-ID2 and non-phosphorylated ID2 antibodies (upper panels). The efficiency of immunoprecipitation with anti-pT27-ID2 antibody from untreated cells was determined to calculate the percent of the pT27-ID2 in the absence and in the presence of CoCl2 (lower panel). d, 293T cells expressing GFP-DYRK1 proteins untreated or treated with 100 μM CoCl2 for 12 h were used as a source of active kinase. The kinase activity of the anti-GFP-DYRK1 immunoprecipitates was tested in vitro using bacterially expressed and purified FLAG-ID2 as substrate. Kinase reactions were evaluated by western blot using p-T27-ID2 antibodies (upper panel). Analysis of kinase reactions by FLAG immunoblot shows similar amount of ID2 protein in each kinase reaction (middle panel). Immunocomplexes were analyzed by western blot using GFP antibody (lower panel). e, Lysates from U251 cells expressing GFP-DYRK1 proteins untreated or treated with of 100 μM CoCl2 for 6 h were immunoprecipitated using GFP antibodies. Western blot was performed using anti-p-Tyrosine (p-Tyr) or GFP antibodies. Analysis of WCL shows similar expression levels of DYRK1 proteins. α-tubulin was used as control for loading. f, Lysates from 293T cells expressing GFP-DYRK1A untreated or treated with 100 μM CoCl2 for 12 h were immunoprecipitated with anti-p-Tyr antibodies and analyzed by western blot using antibodies against GFP. α-tubulin was used as control for loading. g, Lysates from 293T cells expressing GFP-DYRK1B untreated or treated with 100 μM CoCl2 for 12 h were immunoprecipitated with anti-p-Tyr antibodies and analyzed by western blot using antibodies against GFP. α-tubulin was used as control for loading. h, U87 transfected with GFP-DYRK1A, GFP-DYRK1B or GFP and FLAG-PHD1, FLAG-PHD2, or FLAG-PHD3 were immunoprecipitated using anti-hydroxyproline antibody. Western blot was performed using GFP antibody (upper panels). Lower panels, WCL.
Extended Data Figure 4. The DYRK1-ID2-T27 pathway controls GSCs and HIF2α.

a, GSC#48 cells were transduced with lentiviruses expressing ID2-WT, ID2-T27A, or the empty vector. b, Cells were analyzed by in vitro LDA. Representative regression plot used to calculate gliomasphere frequency in panel c. c, The frequency of cells capable of forming gliomaspheres by in vitro LDA. Data in the histograms represent means of 3 biological replicates ± s.d.; **: p = 0.00163. d, The microphotographs show representative gliomasphere cultures of cells treated as in a. e, HIF2α mRNAs from cells treated as in a were analyzed by semi-quantitative RT-PCR. f, U87 cells stably expressing FLAG-ID2 or FLAG-ID2-T27A were analyzed by western blot using the indicated antibodies. Arrows point to specific bands. Asterisk indicates a non-specific band. g, GSC#34 cells were transduced with lentiviruses expressing DYRK1B-V5 or empty vector. Cells were analyzed by western blot using the indicated antibodies. Arrow points to specific band. Asterisk indicates a non specific band. h, qRT-PCR from cells treated as in g. Data in the histograms represent means ± s.d. (n=9, triplicate experiments each performed in triplicate; ***: p = 8.44524E-07 for TGFA). i, GSC#31 was transduced with lentiviruses expressing DYRK1B-V5 or empty vector. Expression of HIF2α, DYRK1B-V5 and α-tubulin was analyzed by western blot. j, mRNAs from experiment shown in Fig. 3a-c were analyzed by semi-quantitative RT-PCR for HIF2α. k, GSC#31 cells were transduced with lentiviruses expressing DYRK1B and ID2, ID2-T27A, or the empty vector. Cells were analyzed by LDA. Representative regression plot used to calculate gliomasphere frequency in Fig. 3c. l, GSC#31 cells were transduced with lentiviruses expressing DYRK1B or the empty vector in the absence or in the presence of undegradable HIF2α (HIF2α-TM). Cells were analyzed by in vitro LDA. Representative regression plot used to calculate the frequency of gliomaspheres in cultures from three independent infections (Vect-Vect = 13.55%; DYRK1B-Vect = 4.36%; DYRK1B-HIF2α-TM = 9.73%).
Extended Data Figure 5. The DYRK1-ID2-T27 pathway modulates HIFα stability by regulating the interaction between ID2 and VHL.
a, In vivo ubiquitylation of HIF1α protein. U87 cells transfected with the expression plasmids HIF1α and MYC-ubiquitin were co-transfected with FLAG-ID2, FLAG-ID2-T27A, or the empty vector in the presence or in the absence of GFP-DYRK1B. After treatment with MG132 (20 μM) for 6 h, lysates were prepared in denaturing buffer and identical aliquots were immunoprecipitated with antibodies directed against MYC. An anti-HA antibody was used to detect HIF1α ubiquitin conjugates (left panels); Cellular lysates, WCL, were analyzed by western blot using the indicated antibodies (right panels). b, U87 cells were co-transfected with plasmids expressing HA-HIF2α and GFP-DYRK1B or GFP-vector. Cells were treated with 50 μg/ml of C HX for the indicated times and analyzed by western blot. c, Quantification of HIF2α protein from the experiment in panel b as the Log2 of the percentage of HIF2α relative to untreated cells. d, IMR32 cells were co-transfected with ID2 and FLAG-VHL or FLAG-HIF1α expressing vectors. Immunoprecipitation was performed using FLAG antibody and immunocomplexes and whole cell lysates were analyzed by western blot using the indicated antibodies. e, IMR32 cells transfected with FLAG-VHL expression vector were used for IgG or ID2 antibody immunoprecipitation. Immunocomplexes and WCL were analyzed by western blot. Arrow points to the specific FLAG-VHL band; asterisk indicates IgG light chain. f, FLAG immunoprecipitation of binding reactions of in vitro translated FLAG-ID and HA-Elongin C proteins. Immunocomplexes were analyzed by western blot for HA and FLAG. g, FLAG-ID proteins and HA-VHL were translated and incubated in vitro. FLAG immunocomplexes were analyzed by western blot for HA and FLAG. h, In vitro streptavidin pull down assay of biotinylated ID2 peptides (amino acid 14-34 WT, pT27, and T27W) and in vitro translated HA-VHL. Bound polypeptides were detected by western blot.
Extended Data Figure 6. Molecular docking of an ID2 (15-31) peptide on the VHL-Elongin C complex.

a, Ribbon representation of the backbone of the VHL complex and the predicted binding conformation of the ID2 peptide. VHL (red ribbon), Elongin C (blue ribbon) and the docked ID2 peptide (purple ribbon). Cul2 contact residues are colored yellow ribbon in both VHL and Elongin C. Arrow indicates the ID2 peptide. b, Docking result for the phospho-T27-ID2 peptide shown from the same perspective as in panel a. c, The view and complex in a is rotated 90 degrees around an axis parallel to the page so that the perspective is from the arrow shown in panel a. d, Electrostatic molecular surface representation of the VHL-Elongin C complex with the docked ID2 peptide. The perspective is the same as in panel c. The T27 side chain is shown as space-filling spheres and is indicates by the red arrow. The N-term and C-term of the ID2 peptide are indicated by purple arrows.
Extended Data Figure 7. DYRK1-mediated phosphorylation of ID2 prevents dissociation of VCB-Cul2 complex.

a, In vivo binding assay using lysates from U87 cells co-transfected with HA-VHL and FLAG-ID2 or FLAG-ID2-T27E expression vectors. FLAG immunocomplexes were analyzed by western blot using HA and FLAG antibodies. Whole cell lysates, WCL, were analyzed by western blot using the indicated antibodies. Binding of FLAG-ID2 and FLAG-ID2-T27E to the bHLH protein E47 is shown as control for ID2 binding. b, U87 cells were transfected with FLAG-ID2, FLAG-ID2-T27A or FLAG-ID2-T27E plasmids. Cellular lysates were analyzed by western blot using the indicated antibodies. c, In vitro binding between purified FLAG-ID2 and His-VHL following in vitro kinase reaction using recombinant DYRK1B and FLAG-ID2. d, Analysis of the HA-Elongin C immunocomplexes in U87 cells transfected with HA-Elongin C in the absence or presence of FLAG-ID2-T27A. Anti-HA immunoprecipitation reactions and WCL were analyzed by western blot using antibodies against Cul2, HA (ElonginC), and FLAG (ID2). e, Analysis of the FLAG-SOCS2 immunocomplexes in U87 cells transfected with ID2, ID2-T27A or the empty vector. FLAG immunoprecipitation reactions and WCL were analyzed by western blot using antibodies against Cul5, ID2, and FLAG (SOCS2). f, Stoichiometric analysis of ID2 and VHL in cellular lysates. Decreasing amount of WCL from 1×10⁶ U87 cells and purified proteins were assayed by western blot (left panels). Regression plots of densitometry analysis were used to determine ID2 and VHL protein concentration and the ID2:VHL ratio (right panel). g, Immunoprecipitation of endogenous VHL in U87 cells in the presence and in the absence of CoCl2. Western blot for Cul2 and VHL are analyzed by western blot. Vinculin is shown as loading control.
Extended Data Figure 8. DYRK1 kinase inhibits proliferation of human glioma.
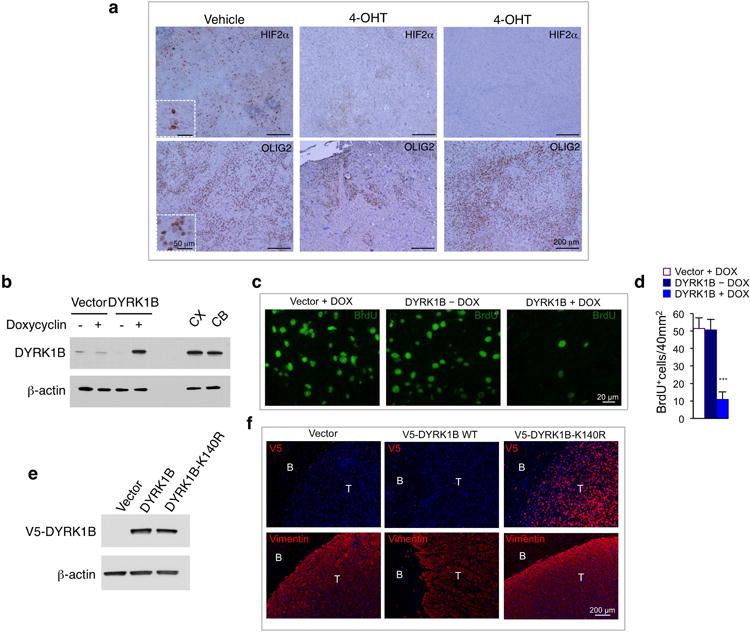
a, Malignant glioma were induced in Id1-Id2-Id3Flox/Flox mice via injection of lentivirus expressing RAS-V12-IRES-CRE-ER linked to U6-shp53 cassette into the dentate gyrus as described9. Mice were treated for 5 days with tamoxifen or vehicle and sacrificed 2 days later. Tumors were analyzed by immunohistochemistry using HIF2α and OLIG2 antibodies. Nuclei were counterstained with hematoxylin. b, Western blot analysis of DYRK1B in U87 cells stably expressing a doxycycline inducible DYRK1B or the empty vector. Cells were treated with 0.75 μg/ml doxycycline or vehicle for 36 h. Lysates of adult mouse cortex (CX) and cerebellum (CB) were used to compare exogenous DYRK1B with endogenous levels of the protein. c, Tissue sections from experiment in Fig. 5e, f were analyzed by immunostaining using BrdU antibodies. d, Quantification of BrdU positive cells from the experiment in c. Data in the histograms represent means ± s.d. (n = 7; ***: p = 3.065E-07, DYRK1B – DOX versus DYRK1B + DOX). Asterisks indicate statistical significance by two-tailed t test. e, Western blot analysis of ectopically expressed V5-DYRK1B, V5-DYRK1B-K140R in U87 cells. f, Brain cross sections of mice intracranially injected with U87 cells in e were analyzed by immunofluorescence using V5 antibody (red, upper panels) to identify exogenous DYRK1B and human vimentin antibody (red, lower panels) to identify human glioma cells. Nuclei were counterstained with DAPI (blue). T, tumor; B, brain.
Extended Data Figure 9.

a, Scatter plot showing the expression of DYRK1A and DYRK1B in GBM. Blue and red dots indicate GBM samples with high or low expression of both DYRK1A and DYRK1B, respectively. GBM samples were used for Kaplan Meier survival analysis to evaluate the prognostic power of the expression of DYRK1A and DYRK1B shown in Fig 5i. b, Distribution of ΔESrand, representing the null model, for ID2 activity (left panel) and ID2 expression (right panel). This distribution is used to calculate the p-value for enrichment of ΔES. Red dot (or vertical black bar) represents the ΔES using HIF2α targets. P-value is calculated as ratio of number of times ΔESrand is greater than ΔES (i.e. falls in green regions) over total trials (=1000).
Extended Data Figure 10. Model for the regulation of HIFα stability by the DYRK1 kinase-ID2 pathway.

In cellular contexts that favor HIFα protein instability (normal oxygen levels, but also low ID2 expression and high DYRK1 expression) prolyl hydroxylases (PHD1) is active and positively regulates DYRK1 kinases. Active, tyrosine phosphorylated DYRK1 kinases keep ID2 under functional constraint by phosphorylation of Thr-27. The VCB-Cul2 ubiquitin ligase complex efficiently ubiquitylates HIFα (left). With decreasing oxygenation and PHD1 inactivation but also in the presence of downregulation of DYRK1, elevated expression of ID2, or ID2-T27A mutation, the un-phosphorylated/un-phosphorylatable pool of ID2 exerts an inhibitory function towards the VCB-Cul2 complex by binding directly VHL and Elongin C proteins and displacing Cul2. This results in HIFα accumulation (right). The transcriptional activation of the ID2 gene, a HIFα target, by HIF2α generates a feed-forward ID2-HIF2α loop that amplifies the effects.
Supplementary Material
Acknowledgments
We thank N. Sherman for phospho-ID2 and ID2-associated proteins analysis by mass spectrometry, C. Warnecke for the plasmid expressing HIF2α-TM, Z. Ronai for FLAG-PHD1, FLAG-PHD2, and FLAG-PHD3, plasmids, A. Flores-Morales for the plasmid expressing FLAG-SOCS2, M. Pagano for cDNAs for RBX1, Elongin B, Elongin C, and KH Kim for pcDNA-VHL. We thank D. D'Arca for preparation of VHL and HIFα constructs. This work was supported by National Institute of Health grants to A. L. (R01CA101644 and R01CA131126), A.I. (R01CA178546 and R01NS061776 and a grant from The Chemotherapy Foundation). V. F. is supported by a fellowship from the American Brain Tumor Association (ABTA). S.B.L. was supported by NRF-2013R1A6A3A03063888 fellowship.
Footnotes
Author Contributions A.I. and A.L. conceived the project, coordinated the study, oversaw the results and wrote the manuscript. S.B.L. designed and performed most biochemical and cell biology experiments and helped writing the manuscript; V.F. generated lentiviral vectors, performed in vitro GSC infections, RT-PCR and binding studies; A.M.C. generated and analyzed glioma xenografts and assisted in GSC experiments; G.L. conducted the in vitro screening assay that identified DYRK1 as the ID2-T27 kinase. M.B. and A.C. conducted gene expression and bioinformatics analyses. J.N.B. provided excess tissue from human GBM for GSC isolation. D.S., K.H. and T.C. generated the computational molecular docking model. All authors discussed the results and commented on the manuscript.
References
- 1.Keith B, Johnson RS, Simon MC. HIF1alpha and HIF2alpha: sibling rivalry in hypoxic tumour growth and progression. Nature Rev Cancer. 2012;12:9–22. doi: 10.1038/nrc3183. [DOI] [PMC free article] [PubMed] [Google Scholar]
- 2.Gordan JD, Bertout JA, Hu CJ, Diehl JA, Simon MC. HIF-2alpha promotes hypoxic cell proliferation by enhancing c-myc transcriptional activity. Cancer Cell. 2007;11:335–347. doi: 10.1016/j.ccr.2007.02.006. [DOI] [PMC free article] [PubMed] [Google Scholar]
- 3.Kondo K, Kim WY, Lechpammer M, Kaelin WG., Jr Inhibition of HIF2alpha is sufficient to suppress pVHL-defective tumor growth. PLoS Biol. 2003;1:E83. doi: 10.1371/journal.pbio.0000083. [DOI] [PMC free article] [PubMed] [Google Scholar]
- 4.Li Z, et al. Hypoxia-inducible factors regulate tumorigenic capacity of glioma stem cells. Cancer Cell. 2009;15:501–513. doi: 10.1016/j.ccr.2009.03.018. [DOI] [PMC free article] [PubMed] [Google Scholar]
- 5.Pietras A, et al. HIF-2alpha maintains an undifferentiated state in neural crest-like human neuroblastoma tumor-initiating cells. Proc Natl Acad Sci USA. 2009;106:16805–16810. doi: 10.1073/pnas.0904606106. [DOI] [PMC free article] [PubMed] [Google Scholar]
- 6.Lasorella A, Benezra R, Iavarone A. The ID proteins: master regulators of cancer stem cells and tumour aggressiveness. Nature Rev Cancer. 2014;14:77–91. doi: 10.1038/nrc3638. [DOI] [PubMed] [Google Scholar]
- 7.Perk J, Iavarone A, Benezra R. Id family of helix-loop-helix proteins in cancer. Nature Rev Cancer. 2005;5:603–614. doi: 10.1038/nrc1673. [DOI] [PubMed] [Google Scholar]
- 8.Lasorella A, Rothschild G, Yokota Y, Russell RG, Iavarone A. Id2 mediates tumor initiation, proliferation, and angiogenesis in Rb mutant mice. Mol Cell Biol. 2005;25:3563–3574. doi: 10.1128/MCB.25.9.3563-3574.2005. [DOI] [PMC free article] [PubMed] [Google Scholar]
- 9.Niola F, et al. Mesenchymal high-grade glioma is maintained by the ID-RAP1 axis. J Clin Invest. 2013;123:405–417. doi: 10.1172/JCI63811. [DOI] [PMC free article] [PubMed] [Google Scholar]
- 10.Vandeputte DA, et al. Expression and distribution of id helix-loop-helix proteins in human astrocytic tumors. Glia. 2002;38:329–338. doi: 10.1002/glia.10076. [DOI] [PubMed] [Google Scholar]
- 11.Hara E, Hall M, Peters G. Cdk2-dependent phosphorylation of Id2 modulates activity of E2A-related transcription factors. EMBO J. 1997;16:332–342. doi: 10.1093/emboj/16.2.332. [DOI] [PMC free article] [PubMed] [Google Scholar]
- 12.Nam HS, Benezra R. High levels of Id1 expression define B1 type adult neural stem cells. Cell Stem Cell. 2009;5:515–526. doi: 10.1016/j.stem.2009.08.017. [DOI] [PMC free article] [PubMed] [Google Scholar]
- 13.Niola F, et al. Id proteins synchronize stemness and anchorage to the niche of neural stem cells. Nature Cell Biol. 2012;14:477–487. doi: 10.1038/ncb2490. [DOI] [PMC free article] [PubMed] [Google Scholar]
- 14.Himpel S, et al. Specificity determinants of substrate recognition by the protein kinase DYRK1A. J Biol Chem. 2000;275:2431–2438. doi: 10.1074/jbc.275.4.2431. [DOI] [PubMed] [Google Scholar]
- 15.Lee K, Deng X, Friedman E. Mirk protein kinase is a mitogen-activated protein kinase substrate that mediates survival of colon cancer cells. Cancer Res. 2000;60:3631–3637. [PubMed] [Google Scholar]
- 16.Gockler N, et al. Harmine specifically inhibits protein kinase DYRK1A and interferes with neurite formation. FEBS J. 2009;276:6324–6337. doi: 10.1111/j.1742-4658.2009.07346.x. [DOI] [PubMed] [Google Scholar]
- 17.Himpel S, et al. Identification of the autophosphorylation sites and characterization of their effects in the protein kinase DYRK1A. Biochem J. 2001;359:497–505. doi: 10.1042/0264-6021:3590497. [DOI] [PMC free article] [PubMed] [Google Scholar]
- 18.Kaelin WG, Jr, Ratcliffe PJ. Oxygen sensing by metazoans: the central role of the HIF hydroxylase pathway. Mol Cell. 2008;30:393–402. doi: 10.1016/j.molcel.2008.04.009. [DOI] [PubMed] [Google Scholar]
- 19.Semenza GL. HIF-1, O(2), and the 3 PHDs: how animal cells signal hypoxia to the nucleus. Cell. 2001;107:1–3. doi: 10.1016/s0092-8674(01)00518-9. [DOI] [PubMed] [Google Scholar]
- 20.Warnecke C, et al. Differentiating the functional role of hypoxia-inducible factor (HIF)-1alpha and HIF-2alpha (EPAS-1) by the use of RNA interference: erythropoietin is a HIF-2alpha target gene in Hep3B and Kelly cells. FASEB J. 2004;18:1462–1464. doi: 10.1096/fj.04-1640fje. [DOI] [PubMed] [Google Scholar]
- 21.Kershaw NJ, Babon JJ. VHL: Cullin-g the hypoxic response. Structure. 2015;23:435–436. doi: 10.1016/j.str.2015.02.003. [DOI] [PubMed] [Google Scholar]
- 22.Nguyen HC, Yang H, Fribourgh JL, Wolfe LS, Xiong Y. Insights into Cullin-RING E3 ubiquitin ligase recruitment: structure of the VHL-EloBC-Cul2 complex. Structure. 2015;23:441–449. doi: 10.1016/j.str.2014.12.014. [DOI] [PMC free article] [PubMed] [Google Scholar]
- 23.Kamura T, et al. Rbx1, a component of the VHL tumor suppressor complex and SCF ubiquitin ligase. Science. 1999;284:657–661. doi: 10.1126/science.284.5414.657. [DOI] [PubMed] [Google Scholar]
- 24.Ohta T, Michel JJ, Schottelius AJ, Xiong Y. ROC1, a homolog of APC11, represents a family of cullin partners with an associated ubiquitin ligase activity. Mol Cell. 1999;3:535–541. doi: 10.1016/s1097-2765(00)80482-7. [DOI] [PubMed] [Google Scholar]
- 25.Giorgi FM, et al. Inferring protein modulation from gene expression data using conditional mutual information. PLoS ONE. 2014;9:e109569. doi: 10.1371/journal.pone.0109569. [DOI] [PMC free article] [PubMed] [Google Scholar]
- 26.Alvarez MJ, Giorgi FM, Califano A. Using viper, a package for Virtual Inference of Protein-activity by Enriched Regulon analysis. Bioconductor. 2014:1–14. [Google Scholar]
- 27.Lofstedt T, et al. Induction of ID2 expression by hypoxia-inducible factor-1: a role in dedifferentiation of hypoxic neuroblastoma cells. J Biol Chem. 2004;279:39223–39231. doi: 10.1074/jbc.M402904200. [DOI] [PubMed] [Google Scholar]
- 28.Chakrabarti L, Galdzicki Z, Haydar TF. Defects in embryonic neurogenesis and initial synapse formation in the forebrain of the Ts65Dn mouse model of Down syndrome. J Neurosci. 2007;27:11483–11495. doi: 10.1523/JNEUROSCI.3406-07.2007. [DOI] [PMC free article] [PubMed] [Google Scholar]
- 29.Contestabile A, et al. Cell cycle alteration and decreased cell proliferation in the hippocampal dentate gyrus and in the neocortical germinal matrix of fetuses with Down syndrome and in Ts65Dn mice. Hippocampus. 2007;17:665–678. doi: 10.1002/hipo.20308. [DOI] [PubMed] [Google Scholar]
- 30.Guimera J, et al. A human homologue of Drosophila minibrain (MNB) is expressed in the neuronal regions affected in Down syndrome and maps to the critical region. Human Mol Genet. 1996;5:1305–1310. doi: 10.1093/hmg/5.9.1305. [DOI] [PubMed] [Google Scholar]
- 31.Hibaoui Y, et al. Modelling and rescuing neurodevelopmental defect of Down syndrome using induced pluripotent stem cells from monozygotic twins discordant for trisomy 21. EMBO Mol Med. 2014;6:259–277. doi: 10.1002/emmm.201302848. [DOI] [PMC free article] [PubMed] [Google Scholar]
- 32.Aranda S, Laguna A, de la Luna S. DYRK family of protein kinases: evolutionary relationships, biochemical properties, and functional roles. FASEB J. 2011;25:449–462. doi: 10.1096/fj.10-165837. [DOI] [PubMed] [Google Scholar]
- 33.Becker W. Emerging role of DYRK family protein kinases as regulators of protein stability in cell cycle control. Cell Cycle. 2012;11:3389–3394. doi: 10.4161/cc.21404. [DOI] [PMC free article] [PubMed] [Google Scholar]
- 34.Hammerle B, et al. Transient expression of Mnb/Dyrk1a couples cell cycle exit and differentiation of neuronal precursors by inducing p27KIP1 expression and suppressing NOTCH signaling. Development. 2011;138:2543–2554. doi: 10.1242/dev.066167. [DOI] [PMC free article] [PubMed] [Google Scholar]
- 35.Litovchick L, Florens LA, Swanson SK, Washburn MP, DeCaprio JA. DYRK1A protein kinase promotes quiescence and senescence through DREAM complex assembly. Genes Dev. 2011;25:801–813. doi: 10.1101/gad.2034211. [DOI] [PMC free article] [PubMed] [Google Scholar]
- 36.Park J, et al. Dyrk1A phosphorylates p53 and inhibits proliferation of embryonic neuronal cells. J Biol Chem. 2010;285:31895–31906. doi: 10.1074/jbc.M110.147520. [DOI] [PMC free article] [PubMed] [Google Scholar]
- 37.Yabut O, Domogauer J, D'Arcangelo G. Dyrk1A overexpression inhibits proliferation and induces premature neuronal differentiation of neural progenitor cells. J Neurosci. 2010;30:4004–4014. doi: 10.1523/JNEUROSCI.4711-09.2010. [DOI] [PMC free article] [PubMed] [Google Scholar]
- 38.Lauth M, et al. DYRK1B-dependent autocrine-to-paracrine shift of Hedgehog signaling by mutant RAS. Nat Struct Mol Biol. 2010;17:718–725. doi: 10.1038/nsmb.1833. [DOI] [PubMed] [Google Scholar]
- 39.Mao J, et al. Regulation of Gli1 transcriptional activity in the nucleus by Dyrk1. J Biol Chem. 2002;277:35156–35161. doi: 10.1074/jbc.M206743200. [DOI] [PubMed] [Google Scholar]
- 40.Yang EJ, Ahn YS, Chung KC. Protein kinase Dyrk1 activates cAMP response element-binding protein during neuronal differentiation in hippocampal progenitor cells. J Biol Chem. 2001;276:39819–39824. doi: 10.1074/jbc.M104091200. [DOI] [PubMed] [Google Scholar]
- 41.Pozo N, et al. Inhibition of DYRK1A destabilizes EGFR and reduces EGFR-dependent glioblastoma growth. J Clin Invest. 2013;123:2475–2487. doi: 10.1172/JCI63623. [DOI] [PMC free article] [PubMed] [Google Scholar]
- 42.Carro MS, et al. The transcriptional network for mesenchymal transformation of brain tumours. Nature. 2010;463:318–325. doi: 10.1038/nature08712. [DOI] [PMC free article] [PubMed] [Google Scholar]
- 43.Reynolds BA, Weiss S. Clonal and population analyses demonstrate that an EGF-responsive mammalian embryonic CNS precursor is a stem cell. Dev Biol. 1996;175:1–13. doi: 10.1006/dbio.1996.0090. [DOI] [PubMed] [Google Scholar]
- 44.Deleyrolle LP, et al. Determination of somatic and cancer stem cell self-renewing symmetric division rate using sphere assays. PLoS Biol. 2011;6:e15844. doi: 10.1371/journal.pone.0015844. [DOI] [PMC free article] [PubMed] [Google Scholar]
- 45.Tropepe V, et al. Distinct neural stem cells proliferate in response to EGF and FGF in the developing mouse telencephalon. Dev Biol. 1999;208:166–188. doi: 10.1006/dbio.1998.9192. [DOI] [PubMed] [Google Scholar]
- 46.Miinea CP, Lienhard GE. Stoichiometry of site-specific protein phosphorylation estimated with phosphopeptide-specific antibodies. Biotechniques. 2003;34:828–831. doi: 10.2144/03344pt01. [DOI] [PubMed] [Google Scholar]
- 47.Bordner AJ, Abagyan R. Ab initio prediction of peptide-MHC binding geometry for diverse class I MHC allotypes. Proteins. 2006;63:512–526. doi: 10.1002/prot.20831. [DOI] [PubMed] [Google Scholar]
- 48.Abagyan R, Totrov M. Biased probability Monte Carlo conformational searches and electrostatic calculations for peptides and proteins. J Mol Biol. 1994;235:983–1002. doi: 10.1006/jmbi.1994.1052. [DOI] [PubMed] [Google Scholar]
- 49.Almond D, Cardozo T. Assessment of immunologically relevant dynamic tertiary structural features of the HIV-1 V3 loop crown R2 sequence by ab initio folding. J Vis Exp. 2010 doi: 10.3791/2118. [DOI] [PMC free article] [PubMed] [Google Scholar]
- 50.Zhao X, et al. The HECT-domain ubiquitin ligase Huwe1 controls neural differentiation and proliferation by destabilizing the N-Myc oncoprotein. Nature Cell Biol. 2008;10:643–653. doi: 10.1038/ncb1727. [DOI] [PMC free article] [PubMed] [Google Scholar]
- 51.Cawthorne C, Swindell R, Stratford IJ, Dive C, Welman A. Comparison of doxycycline delivery methods for Tet-inducible gene expression in a subcutaneous xenograft model. J Biomol Tech. 2007;18:120–123. [PMC free article] [PubMed] [Google Scholar]
- 52.Zhao X, et al. The N-Myc-DLL3 cascade is suppressed by the ubiquitin ligase Huwe1 to inhibit proliferation and promote neurogenesis in the developing brain. Dev Cell. 2009;17:210–221. doi: 10.1016/j.devcel.2009.07.009. [DOI] [PMC free article] [PubMed] [Google Scholar]
- 53.Wang K, et al. Genome-wide identification of post-translational modulators of transcription factor activity in human B cells. Nature Biotechnol. 2009;27:829–839. doi: 10.1038/nbt.1563. [DOI] [PMC free article] [PubMed] [Google Scholar]
Associated Data
This section collects any data citations, data availability statements, or supplementary materials included in this article.