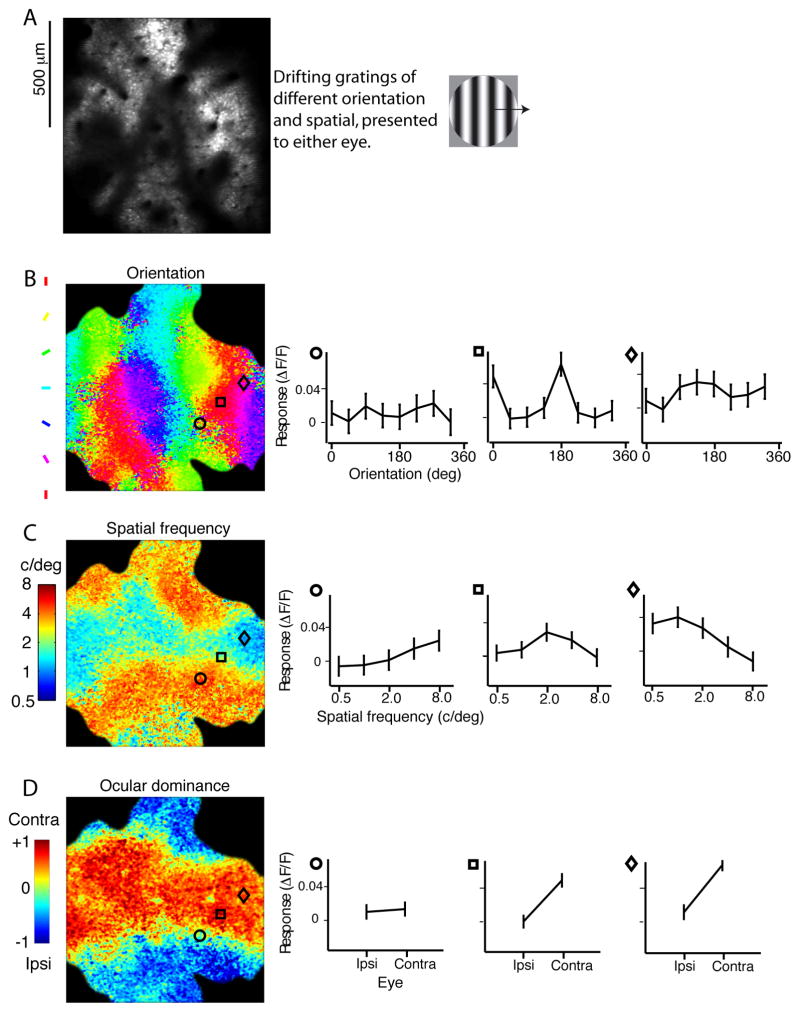
Figure 1. Computing the preferred orientation, SF, and OD at each pixel.
(A) The average image from a single trial. Cells can be clearly seen in the image, but pixels are too large to determine the response of each cell independently of neuropil contributions. Drifting gratings of different orientation and SF were shown over the receptive fields for each eye. (B) Orientation map. The preferred orientation at each pixel is computed from the tuning curves. The tuning curves from three pixel locations are shown to the right. Standard-error bars were computed from variability across stimulus presentations. (C) SF map. The color at each pixel represents the center-of-mass of the SF tuning curve. (D) OD map. Eye preference was computed by taking the response to the contralateral eye, minus the response to the ipsilateral eye, and dividing by the sum of both.

