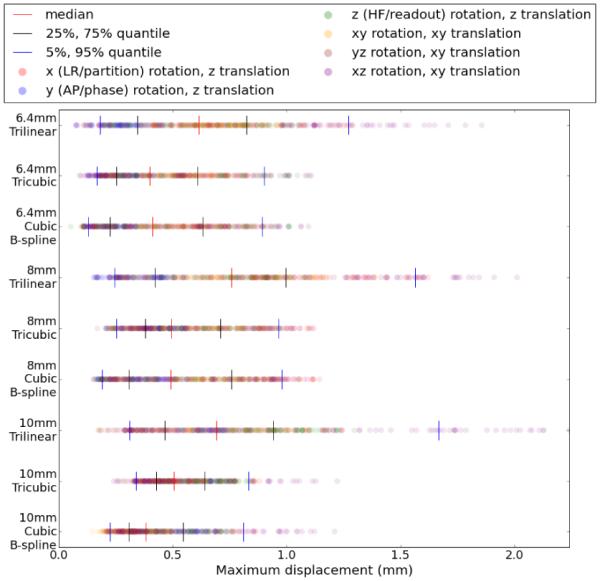
Figure 4.

Maximum error displacement from cubic B-spline, tricubic and trilinear interpolation, with each row representing a separate algorithm/resolution combination. Each of the 420 results is plotted as a dot in each row, colored based on the ground truth axis of rotation. Quantiles are displayed with vertical lines.
