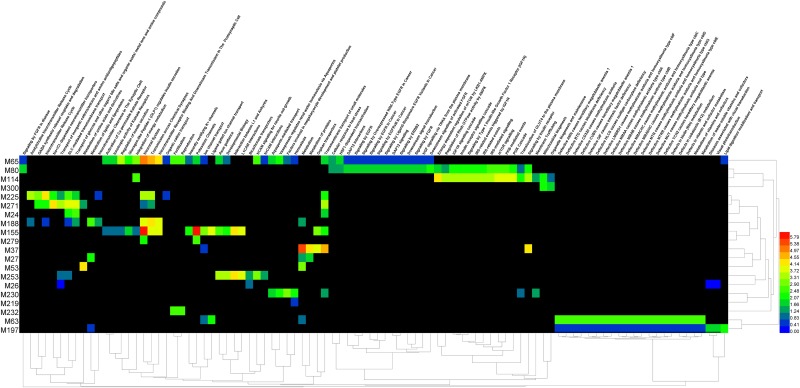
Fig 4. Heat map of 94 common pathways corresponding to enrichment in 20 modules.
X-axis: pathway; Y-axis: module. Color key from blue to red is representative of low to high enrichment (p value from large to small). If the cross of module and pathway form a black cell, it refers to that the pathway in the module is not enriched.

