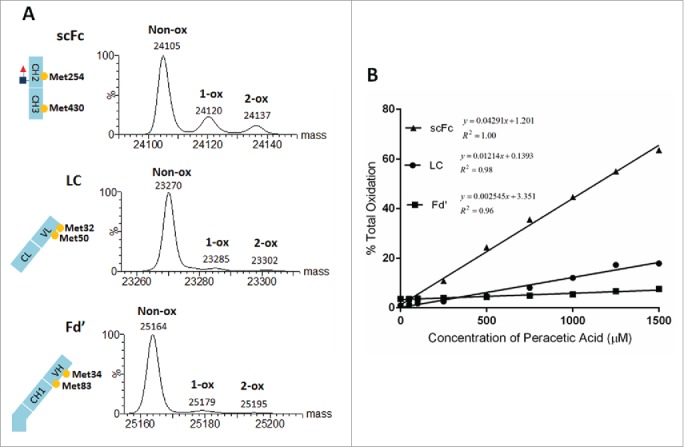
Figure 6.

Three subunits of mAb-B with indicated methionine residues and corresponding deconvoluted mass spectra for the sample treated with 500µM peracetic acid (A). The sum of 1-ox and 2-ox species in Panel A was plotted as a function of peracetic acid concentration (B).
