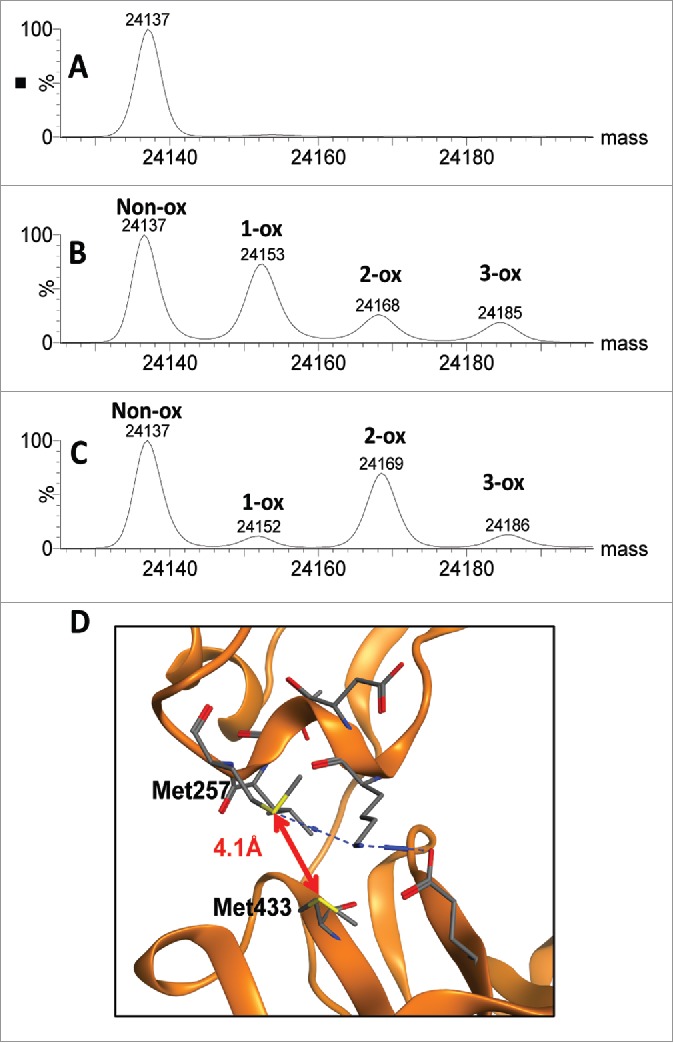
Figure 8.

Comparison of scFc methionine oxidation induced by chemical and photo stress. Deconvoluted mass spectra for the scFc subunit of mAb-A are presented for the unstressed control (A), peracetic acid stressed sample (B) and photo stressed sample (C). Structural model of the CH2:CH3 interface showing close proximity of HC Met257 and HC Met433 in mAb-A (D).
