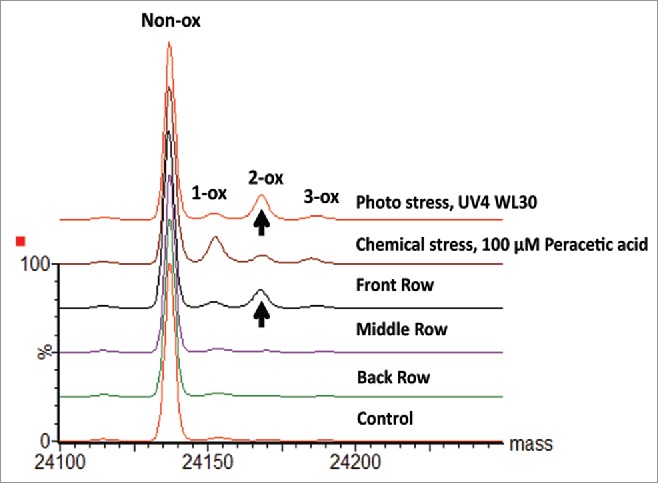
Figure 9.

Deconvoluted spectra of mAb-A DP samples. Overlaid deconvoluted mass spectra of mAb-A scFc subunits are presented for samples collected from different positions in the vial tray along with results from photo and chemically stressed samples.
