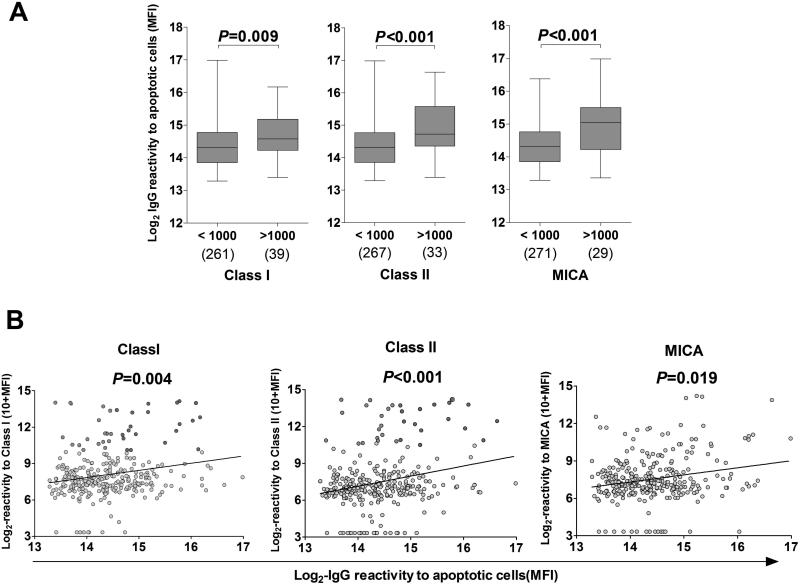
Figure 4. IgG reactivity to apoptotic cells and HLA.
(A) Comparison of IgG reactivity to apoptotic cells in pre-transplant patients. Patients whose serum reacted to HLA Class I, HLA Class II, or MICA (MFI ≥ 1000) were separated from patients whose serum did not react strongly (MFI < 1000). The IgG reactivity to apoptotic cells (Log2 MFI) was compared between the 2 groups. The numbers of samples analyzed in each group are shown below the box plot. P values from two-tailed Mann Whitney tests are shown for corresponding box pairs. The horizontal bar represents the median value; the bottom and top of each box represent the 25th and 75th percentiles; the lower and upper bars of each box represent the minimum and maximum values. (B) Correlation between IgG reactivity to apoptotic cells and IgG reactivity to HLA or MICA in pre-transplant patients (N=300). IgG reactivity to apoptotic Jurkat cells (X axis) and reactivity to HLA class I, HLA class II or MICA (Y axis) are depicted as log2 MFI and log2 (10+MFI), respectively. Each circle represents the serum of one patient. Dots corresponding to sera reactive to HLA class I, class II or MICA (>1000) are colored in green or red if their reactivity to apoptotic cells was below or above the median respectively. P values from Spearman correlation tests are shown for corresponding groups.

