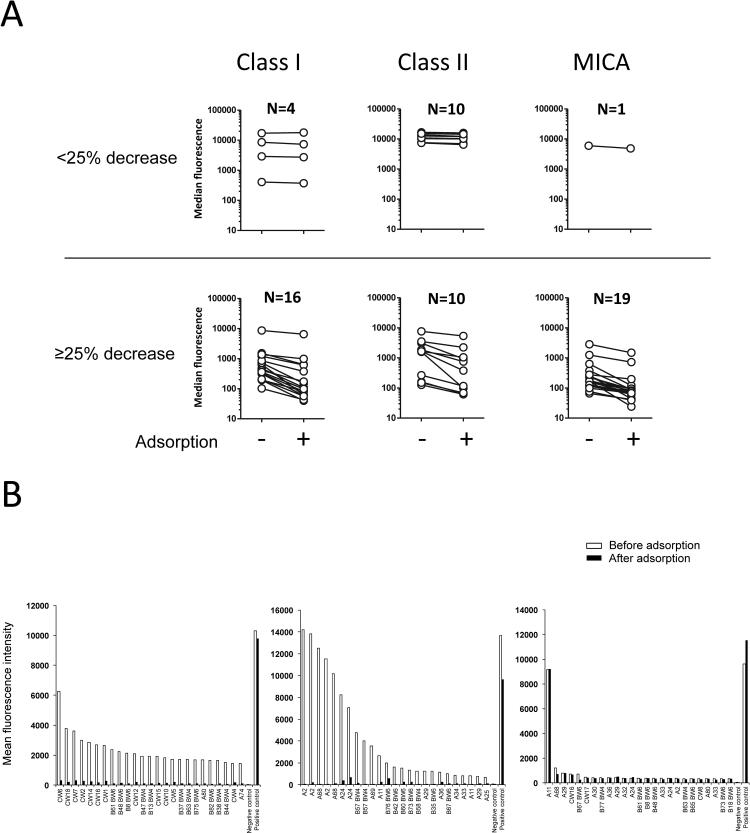
Figure 6. Adsorption of serum reactivity to HLA.
(A) Reactivity of sera from 20 kidney transplant recipients to Class I, Class II, and MICA was measured by Luminex (Labscreen mixed beads) before and after adsorption on apoptotic cells. For clarity, sera for which the reactivity was not reduced by adsorption (<25% decrease; upper panels) are presented separately from sera for which the reactivity was significantly decreased after adsorption (≥ 25%, lower panel). (B) The reactivity of three representative sera to HLA Class I was measured by Luminex (SAB) before and after adsorption on apoptotic cells. Only the 25 antigens towards which the supernatants reacted the most are depicted. Antigens are sorted based on the supernatant reactivity to regular single antigen beads.

