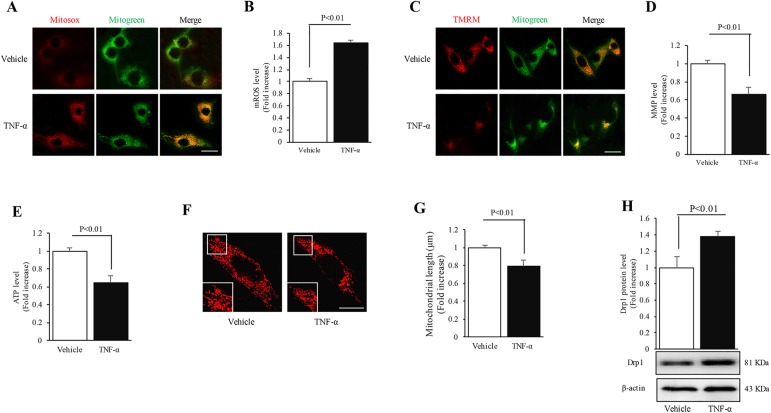
Fig 2. Changes in mitochondrial function and morphology of MC3T3-E1 cells during inflammation.
(A) Representative images of Mitosox red staining. (B) Level of mitochondrial ROS was assessed by Mitosox red staining intensity. (C) Representative images of TMRM staining. (D) Level of mitochondrial membrane potential was assessed by TMRM staining intensity. (E) ATP production was detected by an ATP assay kit. (F) Representative images of Mitotracker Red staining. Middle panels show magnified images corresponding to the indicated bilateral images. (G) Quantification of average mitochondrial length. (H) Quantification of immunoreactive bands of Drp1. Representative immunoblots are shown in the lower panel. Image intensity was quantified using NIH Image J software. (Scale bar = 10 μm). N = 5–7 cell lines/group. P< 0.05 versus the vehicle-treated group.

