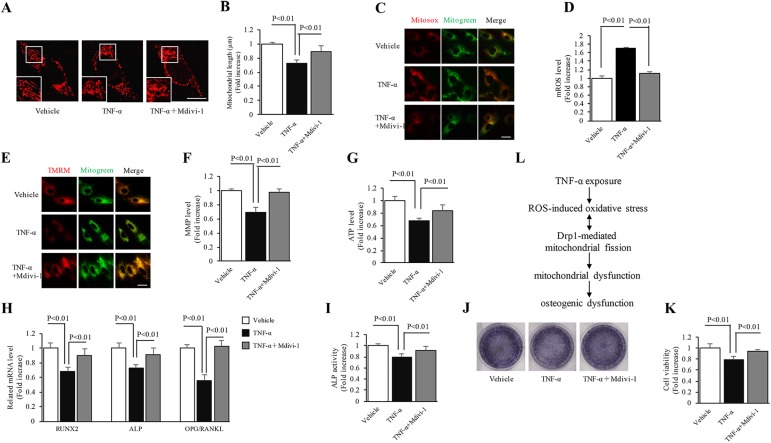
Fig 4. Effect of Mdivi-1 treatment on the inflammatory response induced by TNF-α.
The cells were treated with 10 μM Mdivi-1 for 24 h. (A) Representative images of Mitotracker Red staining. Lower panels show magnified images corresponding to the indicated images. (B) Quantification of average mitochondrial length. (C) Representative images of Mitotracker Red staining. Lower panels show magnified images corresponding to the indicated images. (D) Quantification of average mitochondrial length. (E) Representative images of TMRM staining. (F) Level of mitochondrial membrane potential. (G) Level of ATP production. (H-K) Gene expression levels of osteogenic markers, ALP activity, ALP expression level and cellular activity, respectively. Image intensity was quantified using NIH Image J software. (Scale bar = 10 μm). N = 5–7 cell lines/group. P< 0.05 versus the vehicle-treated group and NAC-added group. (L) Working hypothesis: ROS-induced oxidative stress resulting from TNF-α exposure triggers an increase in Drp1 expression leading to mitochondrial dynamic imbalance, resulting in mitochondrial dysfunction and subsequent osteogenic dysfunction.

