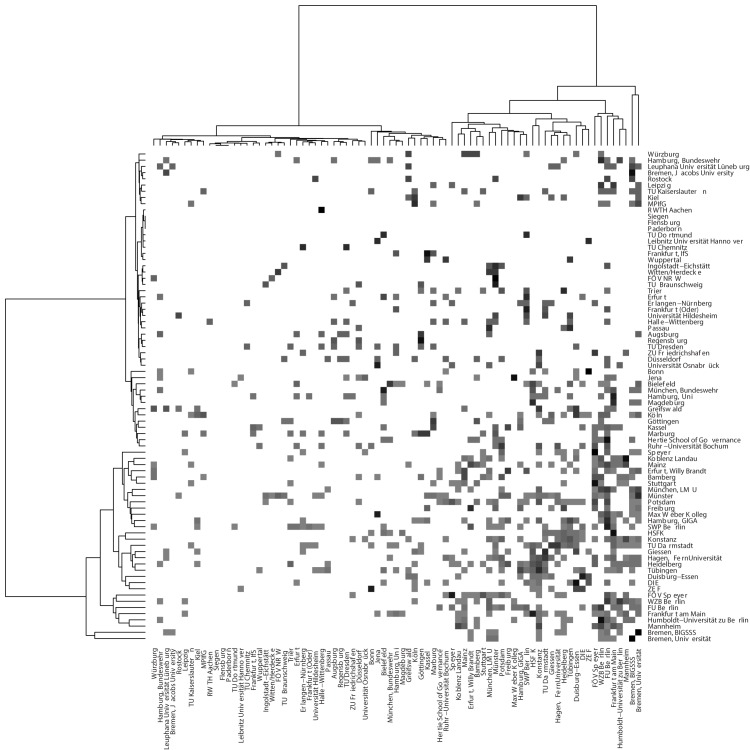
Fig 19. Heat map of the co-authorship network aggregated at the level of research organizations.
Weights in the network denote how many individual collaboration ties between researchers exist across any two universities or research institutes. The dendrograms show the result of a hierarchical cluster analysis based on Ward’s criterion (with non-squared distances).

