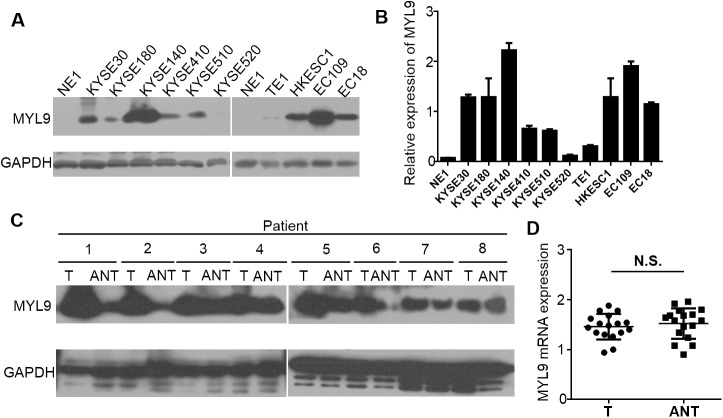
Fig 1. Western blotting and qPCR analyses of MYL9 expression in ESCC cell lines and tissues.
(A) MYL9 protein and (B) mRNA expression levels in NE1 and ESCC cell lines. Expression levels were normalized against GAPDH. Error bars represent the standard deviation of the mean (SD), which was calculated from three parallel experiments. (C) Representative western blots of MYL9 protein expression in eight matched pairs of ESCC tissues (T) and adjacent noncancerous tissues (ANT). GAPDH was used as the loading control. (D) Statistical analyses of MYL9 mRNA expression in matched paired T and ANT. N.S., not significant.

