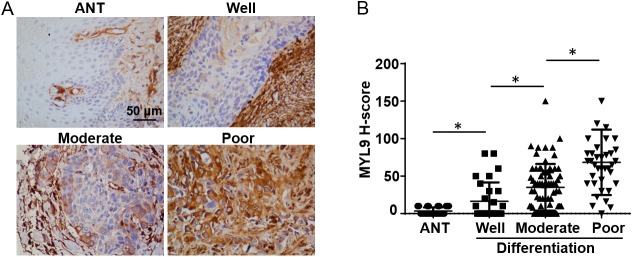
Fig 3. Association between MYL9 expression levels and tumor differentiation.
Representative staining of MYL9 expression in adjacent noncancerous tissue (ANT) and in well-, moderately, and poorly differentiated tumors. Scale bar = 50 μm. (B) The average MYL9 staining score was increased from well-differentiated to poorly differentiated tumors, and was significantly higher than that in ANT regions. IHC H-scores are expressed as the mean ± SD (bars); *p < 0.05.

