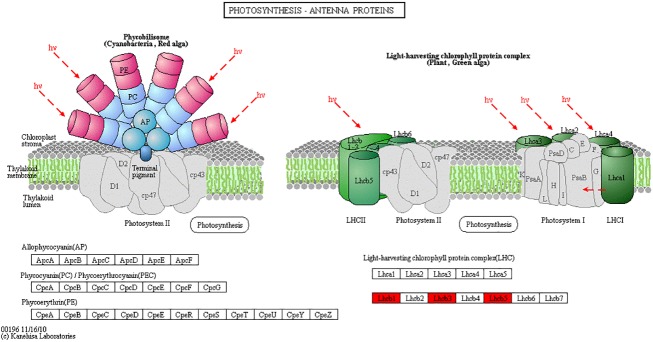
Fig 4. Differentially expressed genes involved in “photosynthesis-antenna proteins.”.
The red column indicates the upregulated enzymes under Pb stress. This color-coded map of DEGs corresponds to map00196 in the KEGG database (http://www.genome.jp/dbget-bin/www_bget?pathway:map00196).

