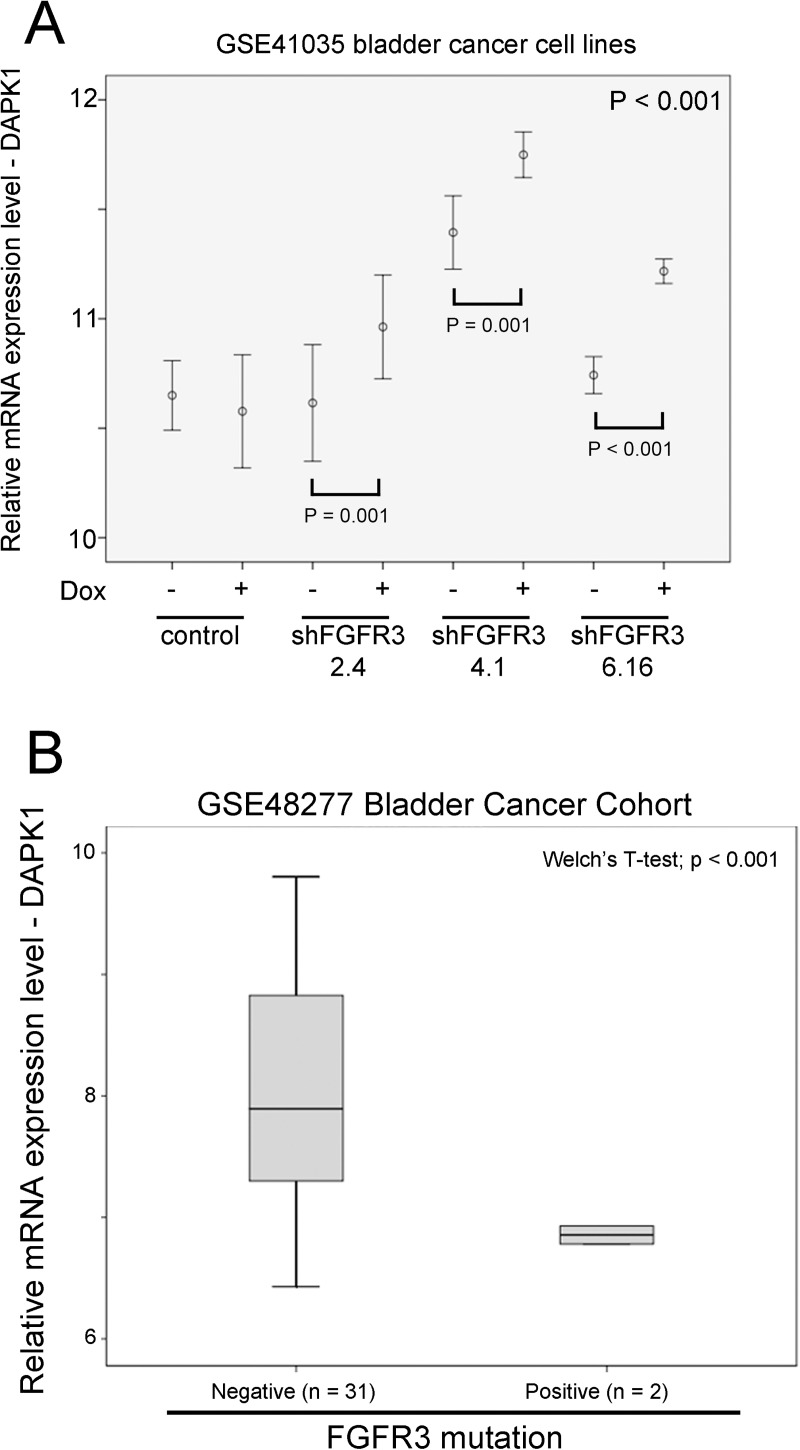
Fig 4. The association between FGFR3 and mRNA expression of DAPK1.
(A) An error bar plot for DAPK1 mRNA expression in bladder cancer cell lines, RT112, with different expression of FGFR3 modulated through doxycyclin inducible shRNA knockdown in GSE41035. (B) A box plot for DAPK1 mRNA expression against FGFR3 mutational status in bladder cancer specimens with low level expression of FGFR3 mRNA.

