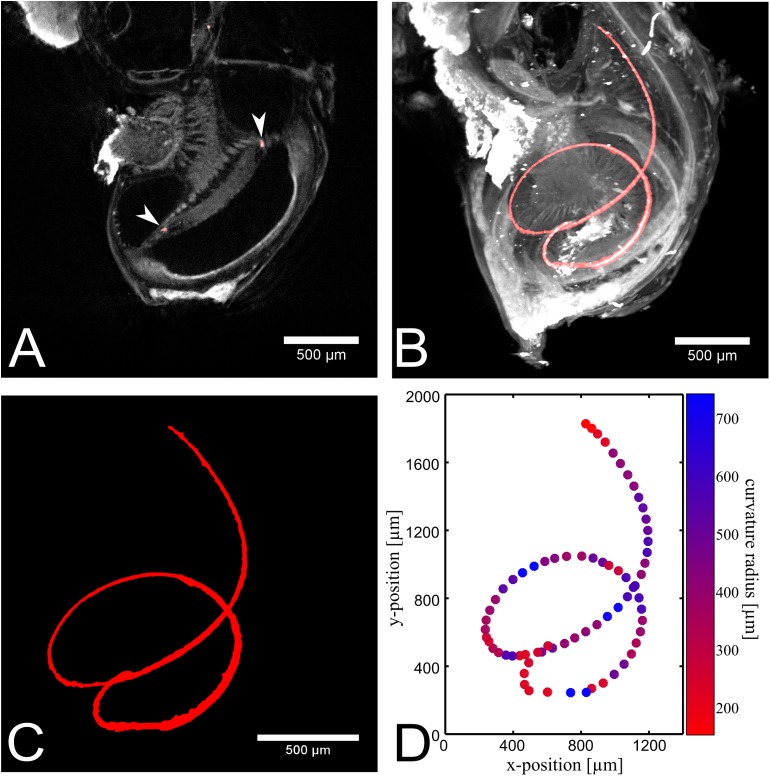
Fig 3. Segmentation of the neurofilament labeling in sample 1.
(A) One slice of the segmentation is overlaid with the reconstructed data. Due to the 3D helical shape, the neurofilament appears in a single slice just as three single points (see arrow heads). (B) Maximum intensity projection of the segmentation, overlayed with the dataset. (C) The segmented area is visualized individually. (D) The extracted points of the segmented area are plotted. The curvature of the neurofilament is indicated by the color map. Blue shows a large curvature radius and red a small curvature radius in μm.

