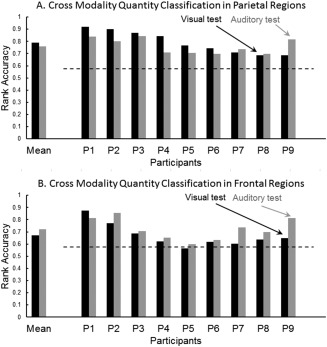
Figure 2.

Cross‐modality quantity classification. A. Parietal regions. B Frontal regions. Black and gray bars represent accuracy for testing visual and auditory modality respectively. The dashed line indicates the P < 0.01 chance level accuracy (0.58).
