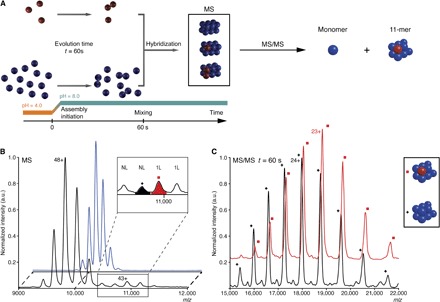
Fig. 2. Oligomeric state characterization of the flexible intermediate by native MS.

(A) Schematics of the isotopic chase experiment. Red and blue colors represent U-[15N,13C,2H]–labeled and unlabeled proteins, respectively. The self-assembly of the labeled and unlabeled samples was initiated in parallel in separate experiments by a synchronized pH jump. After 60 s, the labeled sample was mixed with an 11-fold excess of unlabeled sample, which assembled into isotopically hybrid dodecamers. (B) MS spectra of native unlabeled (blue) and “isotopically chased” hybrid (black) TET2 assembled as described above. The inset shows additional peaks appearing in hybrid dodecamers, which were subjected to the further tandem MS analyses. The major species were annotated above each peak: 1L and NL correspond to TET2 dodecamer containing one labeled monomer or fully unlabeled assembly, respectively. (C) Tandem mass spectra generated from the ions displayed on (B) at m/z 10,650 (black spectrum) and 10,980 (red spectrum). After dissociation in the gas phase, the 10,650 ions generated fully unlabeled 11-mers (11-mer) (black +, peak annotated 24+ is at m/z 17,890). The 10,980 ions dissociated into 11-mer, containing a labeled subunit and 10 unlabeled proteins (red square, 23+ peak is at m/z 18,832).
