
Fig. 3. TET2 self-assembly intermediate states.
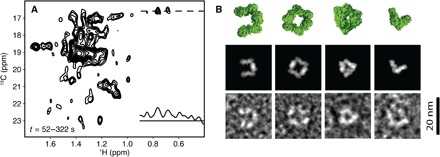
(A) Sum of the dodecamer-subtracted spectra between 52 and 322 s, including a 1H 1D slice extracted at the position of the cross peak of A194 (see Fig. 1). (B) EM projections of oligomeric intermediates captured at 2 min (bottom) and back projections (middle) of corresponding oligomeric structures (top). From left to right: horseshoe-like hexamer, square octamer, triangle hexamer, and V-shaped tetramer.