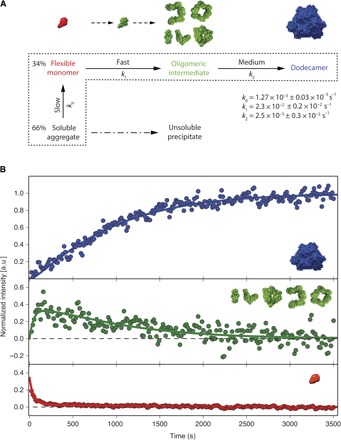
Fig. 4. Kinetic model of TET2 self-assembly.

(A) Kinetic model of the TET2 self-assembly initiated by a pH jump. The jump from pH 4 to 8 induced the conversion of the acid-stabilized monomer to the flexible monomeric intermediate and soluble aggregate. Dashed area surrounds the states included in the fit. Dash-dotted arrow indicates precipitation of the soluble aggregate. The structures of the corresponding states are visualized above the kinetic model. The monomer with stable tertiary structure (green) represents the necessary step in the transition of flexible monomer (red) to ensemble of oligomeric states (green). (B) Fit of the progress curves into time-dependent peak intensities of corresponding states. The solid green line represents the progress curve of oligomeric intermediates (green). Flexible intermediate evolution is shown in red, whereas the stable dodecamer buildup is represented in blue.
