
Fig. 2.
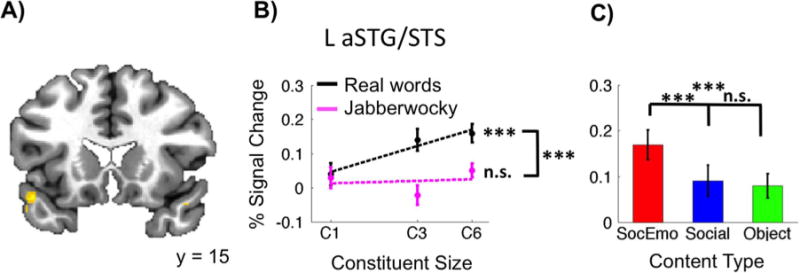
Constituent Size modulated anterior temporal lobe activity. A) Group maps plotted on the TT_N27 anatomy revealed a cluster within left aSTG/STS. B) This cluster demonstrated increasing Constituent Size effects for real words but not jabberwocky. A significant difference between the real word and jabberwocky slopes existed. C) This region also demonstrated a Content Type bias towards Social-Emotional stimuli. The cluster survived multiple comparisons correction (FDR, q = 0.05). The line plot is on a log-linear scale, with best-fit lines fitted to the beta values. Both graphs show percent changes for each condition from the mean signal, which was calculated across all runs, and error bars on graphs indicate ± 1 SEM. Two-sided t-tests were used for all post-hoc tests (***: p < 0.001;**: p < 0.01;*: p < 0.05; t: p < 0.1; n.s.: p > 0.1).