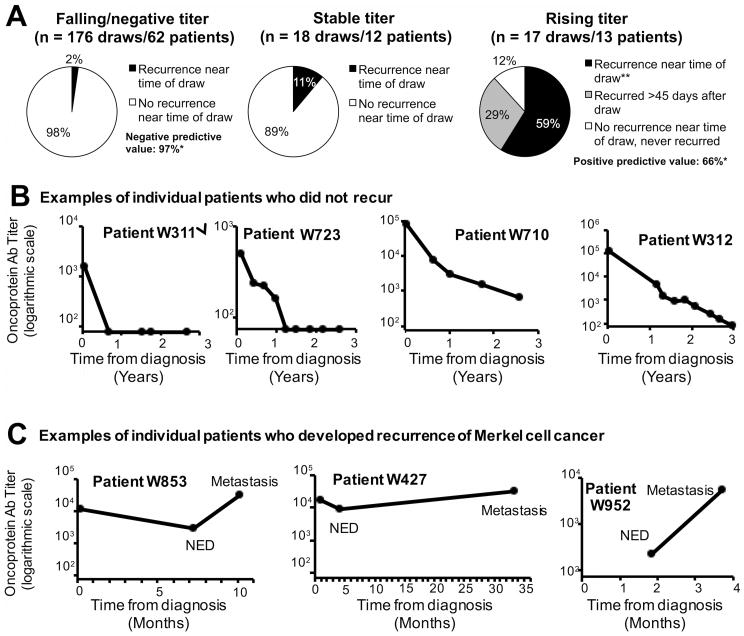
Figure 3. Prospective validation of serial MCPyV antibody levels as a marker for recurrence among patients who are antibody positive at diagnosis.
A total of 71 patients were antibody positive at diagnosis, definitively treated, and had serial follow-up draws (n=282 draws: 71 initial and 211 follow-up) during the study period. These patients were followed prospectively to determine whether MCPyV antibody trend between draws could be used clinically as a tumor marker/biomarker for recurrence. A) Association of titer trend with recurrence. A total of 176 draws were falling by >20% as compared to previous draw. In 98% of cases, patients were without evidence of disease by clinical assessment (exam and/or scans). *After statistically accounting for multiple draws in an individual subject, the negative predictive value (likelihood that a falling titer represented no progression) was 97%. Conversely, there were 17 draws from 13 patients associated with a rising titer. In 59% of cases, recurrence could be detected at the time of the positive/rising titer while an additional 29% developed overt metastasis after the study period. The positive predictive value for detectable recurrence at the time of rising titer was 66%. **p<0.05 for proportion of patients in recurrence, comparing patients with rising titer(59%) with patients with falling/negative titer (2%). The number of patients in the three groups (stable, failing, or rising titers) is greater than 71 because some patients were evaluable in more than one category (such as a patient who initially had a falling titer and then later had a rising titer). B) Examples of individual patients who did not recur. 4 of the 54 patients who did not recur during the study period are shown. Approximately half of patients who did not recur became seronegative during the study period, at a median of 9 months. Note the logarithmic Y-axis (titer) and the X (time) axis in years. C) Examples of individual patients who recurred. 3 of the 17 patients who developed recurrence during the study period are shown. Note that the X (time) axis is now depicted in months.

