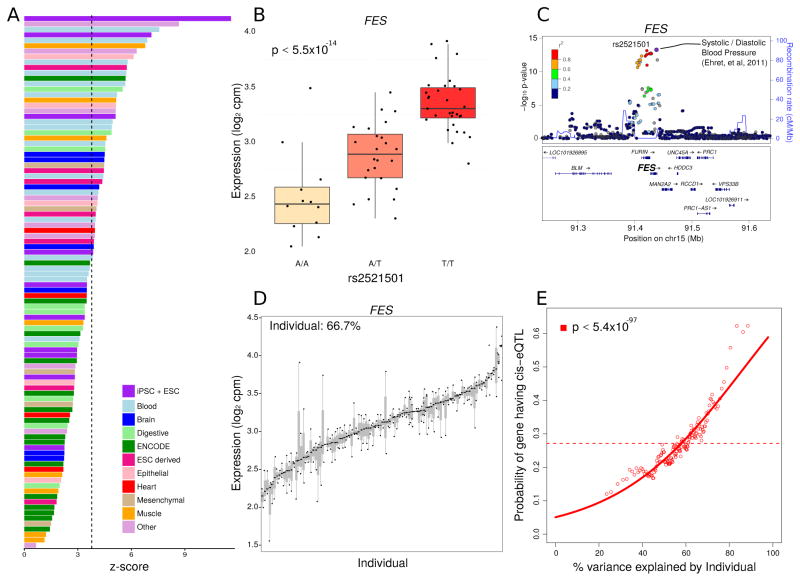
Figure 2. Function and Interpretation of eQTLs.
A) eQTLs show highest enrichment in enhancers in iPSCs and ESCs. Z-scores indicate the degree of enrichment in enhancers represented in cells and tissues samples from (Roadmap Epigenomics Consortium, 2015). Bars are colored based on tissue origin and the dashed line indicates the Bonferroni cutoff for multiple testing. B) rs2521501 is the most significant eQTL for the exemplary FES locus. Expression of FES is shown stratified by genotype at this SNP. C) LocusZoom plot shows −log10 p-values for variants in the FES locus. rs2521501 is an eQTL for FES and is also associated with systolic and diastolic blood pressure. D) FES shows high variation across individuals and low variation within individuals. Each bar represents an individual and the size of the bar represents the variation in FES expression within that individual. E) Probability of each gene having a cis-eQTL plotted against the percent variance explained by individual. Dashed lines indicate the genome-wide average probability, and curves indicate logistic regression smoothed probabilities as a function of the percent variance explained by individual. Points indicate a sliding window average of the probability of genes in each window having a cis-eQTL (window size is 200 genes with an overlap of 100 genes between windows). The p-value shown indicates the probability that an association as strong as between percent variance and eQTL probability occurs by chance according to the logistic regression smoothing. See also Figure S5

