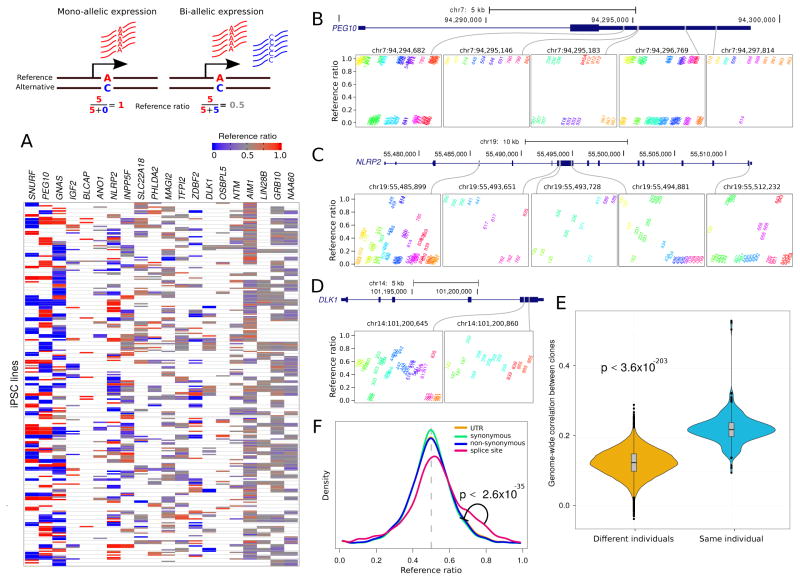
Figure 3. Allele-Specific Expression.
Diagram illustrates mono- and bi-allelic expression. A) Reference ratios for each set of canonically imprinted genes show the consistency of allele-specific expression (ASE) within multiple iPSC lines from the same individual. Red indicates expression of the reference allele, blue indicates expression of the alternative allele and grey indicates a mix. White indicates that ASE could not be assessed due to the lack of a heterozygous SNP with sufficient coverage. B) PEG10 exhibits strong allelic imbalance at 5 sites where the expressed allele is consistent in multiple iPSC lines from the same individual. Reference ratios are shown at 5 sites for individuals that are heterozygous at each site. Multiple iPSC lines from the same individual have the same color and labels indicate the individual identifier for each iPSC line. C) NLRP2 exhibits more variation in allele imbalance across individuals, but retains consistency in multiple iPSC lines from the same individual. D) DLK1 shows loss of imprinting but retains consistency within multiple iPSC lines from the same individual. E) Genome-wide correlation based on allelic imbalance at sites shared by each pair of individuals indicates that iPSC lines from the same individuals show higher similarity in ASE than iPSC lines from different individuals. F) Genome wide reference ratios for SNPs in splice site regions show increased expression of the reference allele, compared to SNPs in UTRs, or SNPs that cause synonymous or non-synonymous changes in coding regions.

