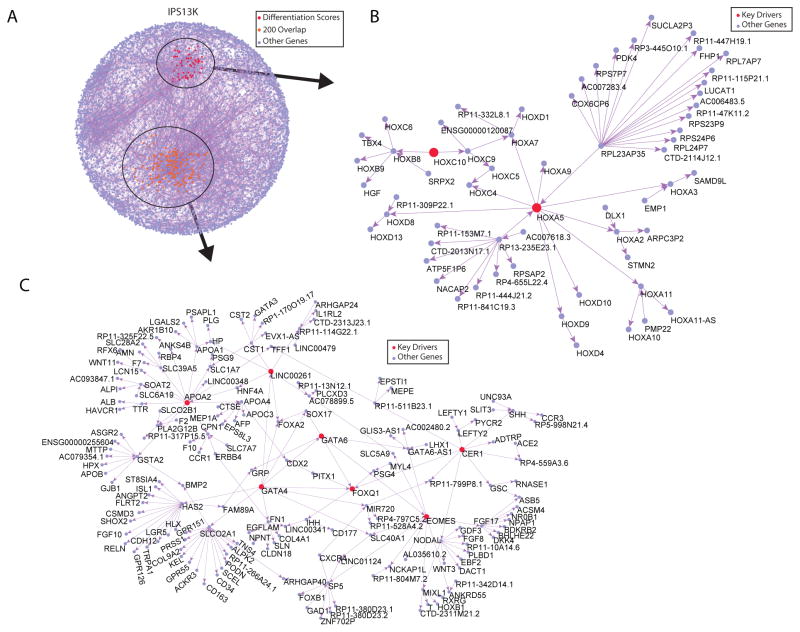
Figure 6. 13K Sub-Networks Downstream of Key Driver Genes of Interest Contribute to iPSC Variability.
A) Causal network covering the 13,990 genes comprising the co-expression modules enriched for the top 3000 most varying genes, the pathways related to development of these modules, and the mapping onto the prior network. The sub-networks 2 steps away from the key drivers of interest are shown in B) and C), with the key drivers shown in red and yellow respectively. See also Figure S6, S7 and Table S5 and S6

