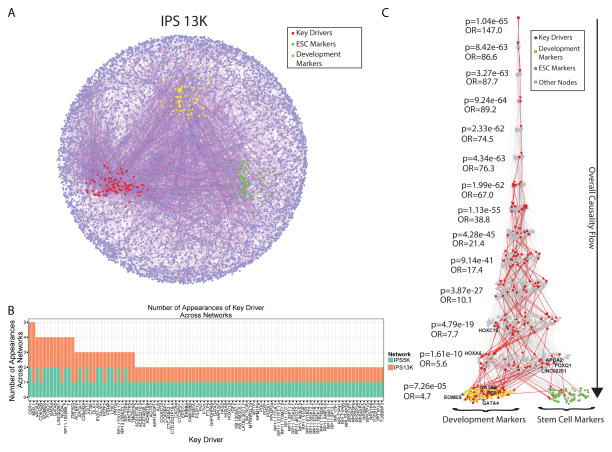
Figure 7. Bayesian Causal Gene Networks, Key Driver Gene Discovery and Network Validation with Prior Information.
A) Causal molecular networks covering the 13,990 genes comprising the co-expression modules enriched for the top 3000 most varying genes, the pathways related to development of these modules, and the mapping onto the prior network. The key drivers genes are highlighted in red, the stem cell markers in green and the development markers in orange. B) Distribution (histogram) of the number of appearances of any key driver gene in both networks, ranked by their total number of appearances. C) The Eiffel Tower plot shows the overall causality flow (top to bottom) from any stem cell (green) or development (yellow) markers to any upstream causal gene in the 13K network. It also shows the enrichment p-value of key driver genes (red) at every step upstream of the markers, assessed using a level-associated Fisher’s exact test. See also Figure S6, S7 and Table S5 and S7

