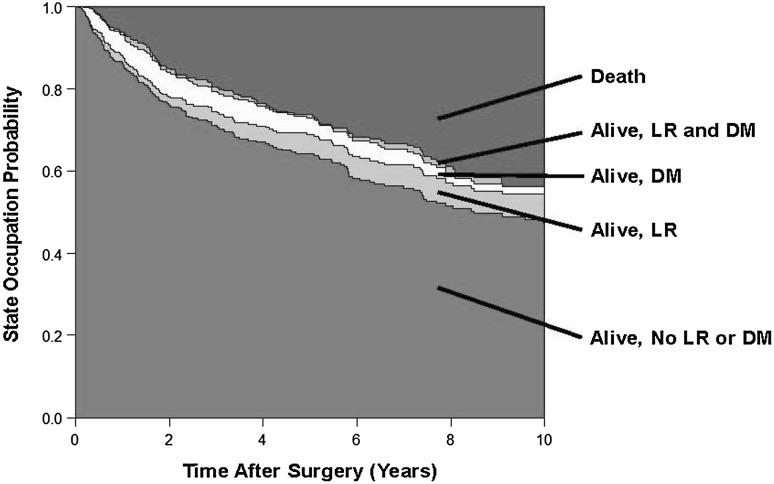
Fig. 3.
The clinical course of patients with soft tissue sarcoma after surgery is shown. The colored boxes represent state occupation probabilities during a 10-year followup. This graph was derived using a stratified hazards model without covariates based on the model design in Fig. 1B. With time, the state occupation probability of State 1 (alive, no recurrence; green) decreases, because patients transition to State 2 (alive, local recurrence; light green), State 3 (alive, distant metastasis; cream), or State 5 (death; red). The state occupation probabilities of the distant metastasis state (State 3) strongly decreases with time, because patients make Transition 7 to the death state (State 5) or Transition 6 to the local recurrence and distant metastasis state (State 4; orange). LR = local recurrence; DM = distant metastasis.

