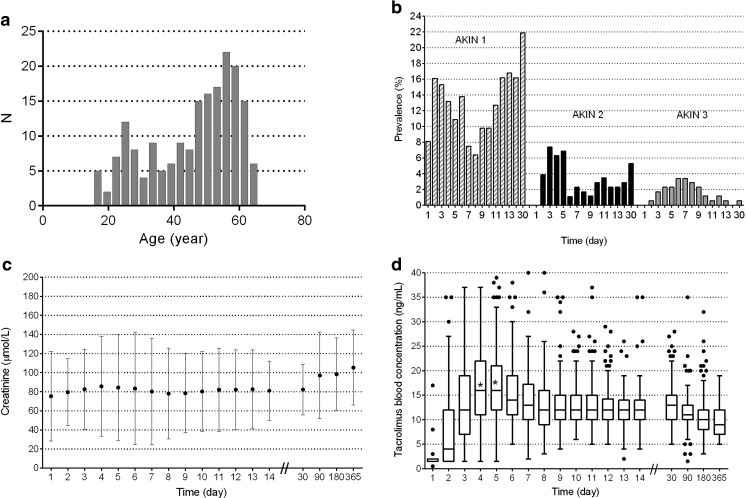
Fig. 1.
a Histogram of age in years. b Prevalence of AKI per day between day 1 and month 1 by stage in 3 stages. c Serum creatinine over time as mean and SD. d Whole-blood tacrolimus trough concentrations over time (box: 25th, median, and 75th percentiles); the asterisks in the boxplots show that the medians on day 4 and 5 were significantly different from 15 ng/mL on day 4 and 5

