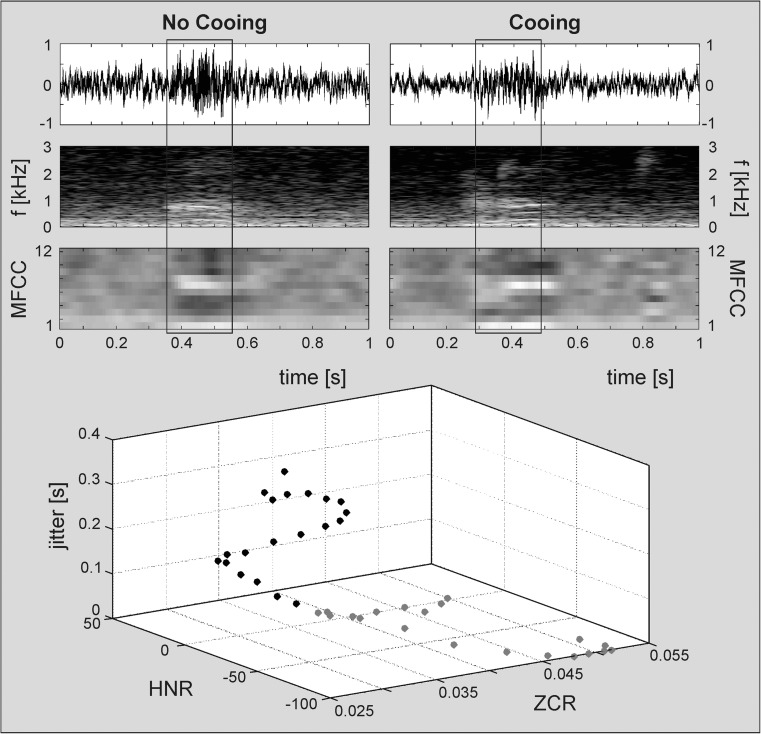
Fig. 4.
Waveforms, spectrograms and visualised Mel-frequency cepstral coefficients (MFCCs) 1–12 for (top left) a vowel-like, low-resonant vocalisation (no cooing), and (top right) a typical cooing vocalisation of a female infant at 56 days post-term. The 3D scatter plot (bottom) shows the distribution of three exemplarily selected acoustic parameters (mean zero-crossings rate [ZCR], mean logarithmic harmonics-to-noise ratio [HNR], mean local jitter) over 20 frames of 0.01 s extracted from the voiced periods (marked with rectangular boxes in upper plots) of either vocalisation (no cooing: 0.35–0.55 s, grey dots; cooing: 0.29–0.49 s, black dots)

