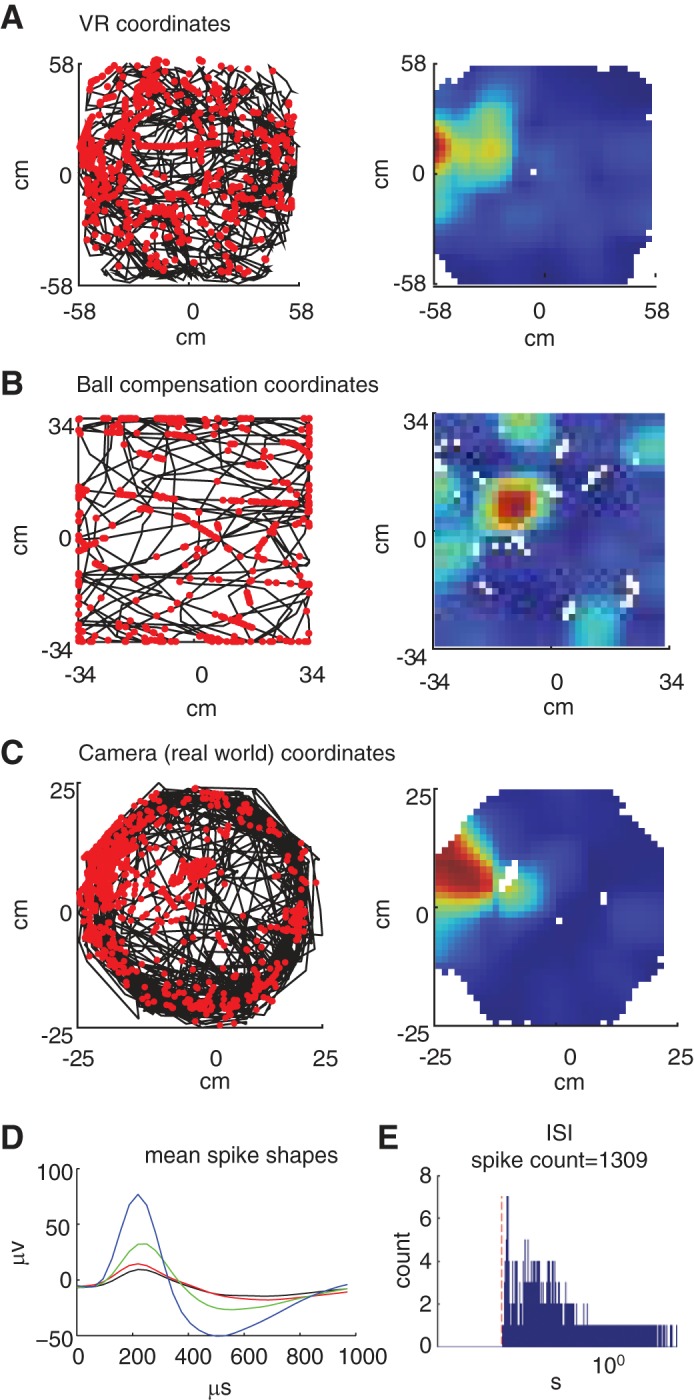
Fig. 8.

Recording of neural activity in a cell of the entorhinal cortex. One 30-min trial in which the rat was running freely in the environment and collecting water rewards from one of the eight possible reward sites in the virtual environment. A, left: trajectory of the rat and spikes in the virtual environment; the black line represents the trajectory of the rat in the virtual environment. Each red dot marks the location of the rat when the cell fired a spike. A, right: rate maps of the trajectory and spikes. B, left: trajectory and spikes according to the compensation of the ball; the black line represents the rotation of the ball during the trial (Xcomp, Ycomp). Each red dot marks the degree of rotation of the ball when the cell fired a spike. Right: Rate maps of the trajectory and spikes. C, left: trajectory and spikes according to the 50-cm diameter cylinder (Xcam, Ycam). The black line represents the trajectory of the rat according to the cylinder (Xcam, Ycam). Each red dot marks the locations of the rat when the cell fired a spike. C, right: rate maps of the trajectory and spikes. D: mMean spike shape: The mean spike shapes of each electrode in recording tetrode (red, green, blue, and black). E: interspike interval (ISI) histogram: Histogram of the ISI of the spike train. The red dashed line marks the 2-ms interval (refractory period). The x (time)-axis is in logarithmic scale.
