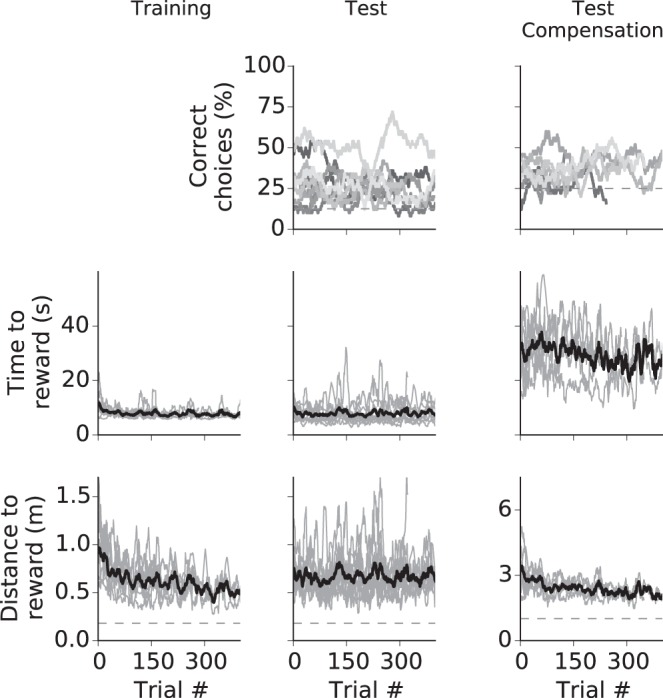
Fig. A2.

Landmark-based navigation. The columns show data for training, test phase and test with compensation. Top: cumulative correct decisions for all animals (different animals may have performed different numbers of trials). The dashed line shows the level of random choice. Middle: time to reward for all animals (light gray lines) and average (black line). Data from single animals are gliding averages with a 50-trial width. Bottom: distance to reward. Dashed line shows the minimum distance.
