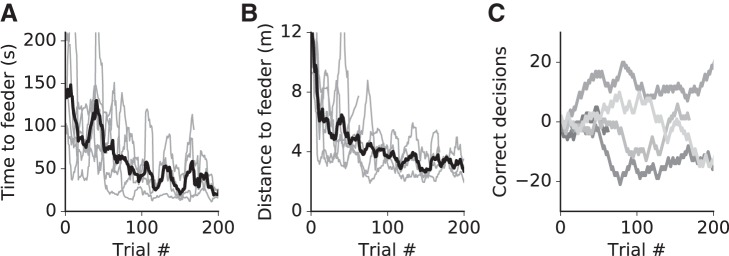
Fig. A3.
Navigation with acoustic cues (pitch experiment). Gray lines are time to feeder (A) and distance (B) to feeder for n = 5 animals, and a corresponding mean (black line) and standard error (gray area). Behavior became more directed within the first 100 trials, leading to a reduction of total locomotion distance and time to reach a feeder. Data from single animals are gliding averages with a 50-trial window. Different animals completed different numbers of trials. C: performance in (cumulative decisions, coded with + or −1, respectively) shows positive learning behavior for 1 individual.

