Fig. 7.

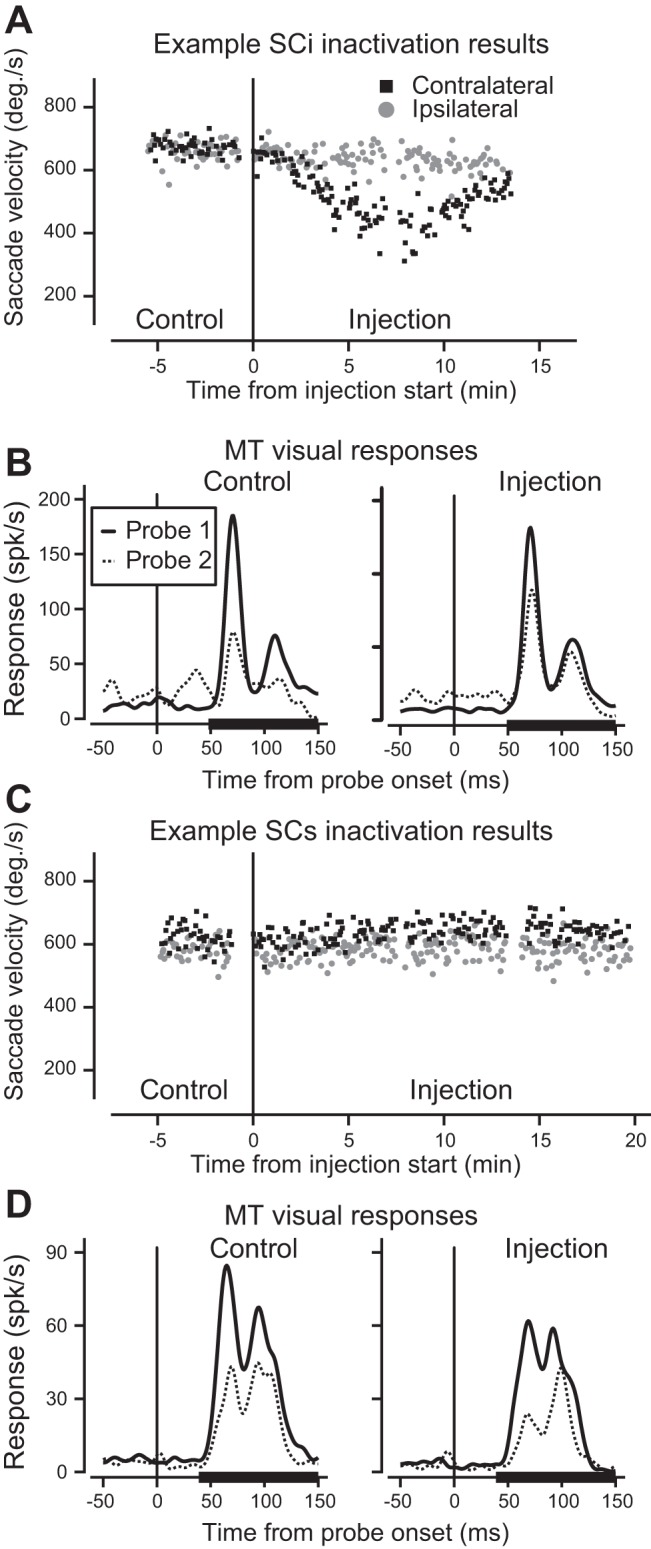
Examples of the two categories SC inactivations. A: peak velocity of saccades toward the contralateral (black squares) and ipsilateral (gray circles) hemifields during inactivation of SCi layers. Time zero indicates the start of the lidocaine injection. B: responses of an MT neuron (for which saccade velocity is shown reducing in A). Probe 1 responses (long before the saccade) are plotted in solid lines, probe 2 responses (just before the saccade) are in dotted lines. The thick black lines on the x-axes show the epoch in which the mean neuronal responses were calculated. C: peak velocity of saccades during inactivation of SCs layers. In contrast to SCi inactivation, saccade velocity did not change. This was remarkably consistent across experiments. D: responses of the MT neuron from the inactivation portrayed in C. Suppression did not change.
