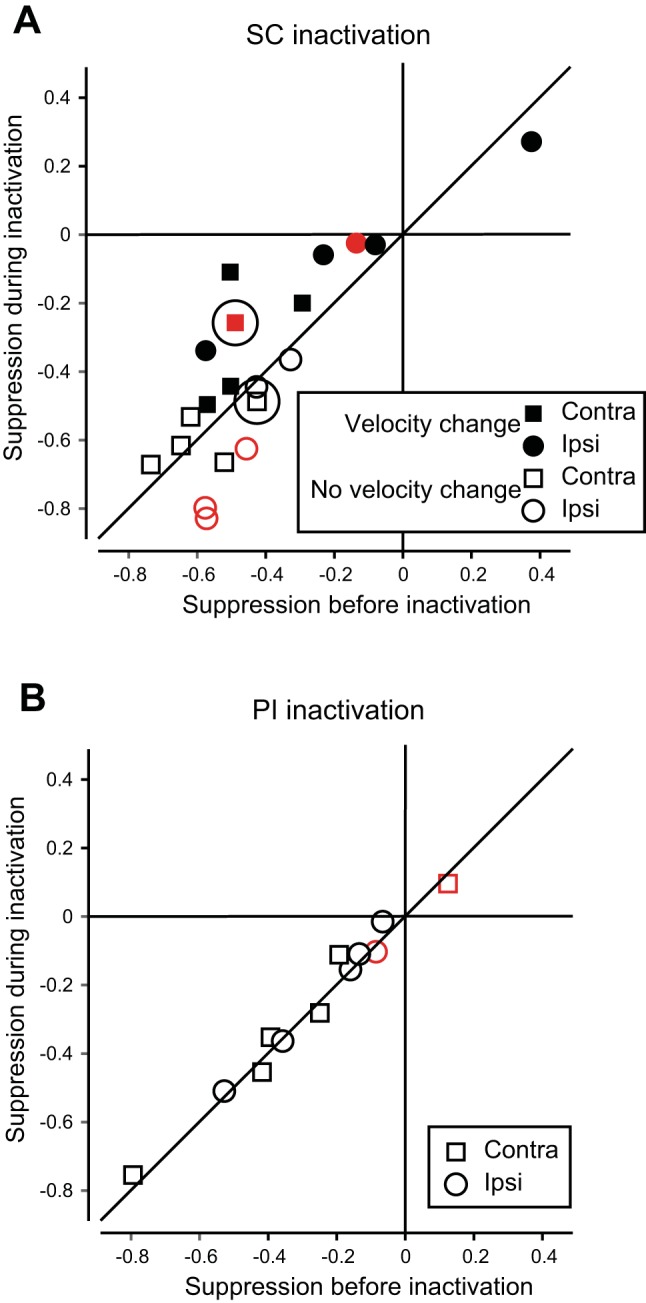
Fig. 8.

Summary of effect of SC and PI inactivation on suppression of MT neurons. A: changes in suppression of 10 MT neurons in monkey OM during SC inactivation. Solid symbols indicate injections in which saccade velocity was reduced (SCi layers, n = 6). Injections with no change in velocity (SCs, n = 4) are shown with open symbols. Significant changes in suppression are indicated by red (solid for SCi, outline SCs). The two examples from Fig. 7 are circled. Points above the diagonal indicate a reduction of suppression during SC inactivation. B: changes in MT saccadic suppression during PI inactivation. Symbols are as in A. The data lie on the diagonal, indicating no change in suppression from PI inactivation.
