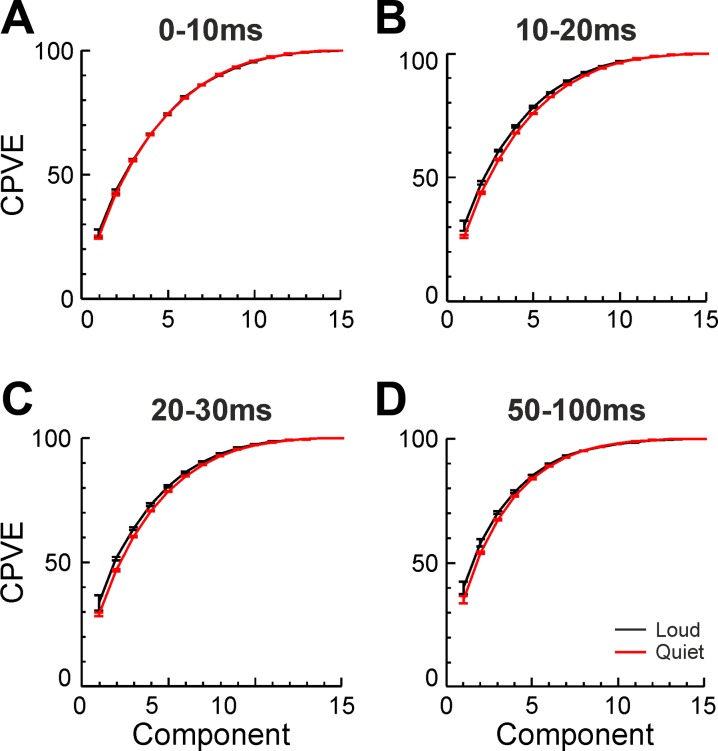
Fig. 5.
The mean CPVE for both loud (black) and quiet (red) cued trials, as found by PCA carried out on mean EMG from 4 different time windows (A–D) relative to the eRT. There was no significant difference between results with loud and quiet cues for any of the time windows (P > 0.05). Error bars represent 1 SE of the mean above and below the mean.

