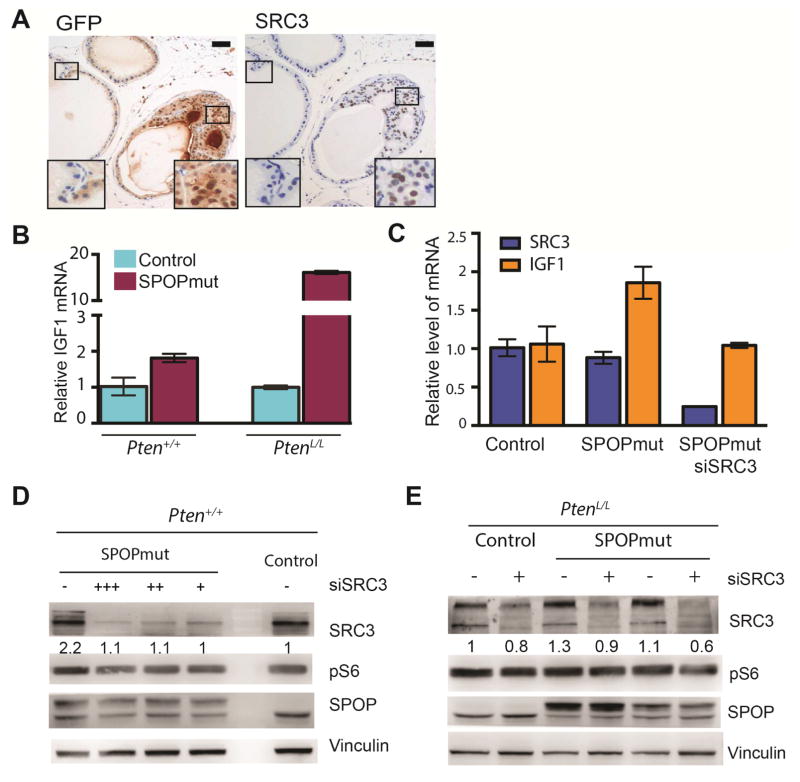
Figure 6. Activation of PI3K/mTOR signaling by mutant SPOP is mediated by SRC3.
(A) IHC for GFP (left), indicating SPOP-F133V expression, as well as SRC3 (right) in prostate tissue from PbCre;R26F133V mice mouse. (Scale bar: 50 μM).
(B) Relative mRNA level of IGF1 in control and SPOPmut cells in either Pten+/+ (left) or PtenL/L (right) background. Data are means ± SEM.
(C) Relative mRNA level of SRC3 (blue) and IGF1 (orange) in control and SPOPmut cells transfected with control siRNA or siRNA targeting SRC3, 48h post transfection.
(D) Western blot for SRC3, pS6, and SPOP protein from control and SPOP-F133V mouse prostate organoids, with control siRNA or SRC3 knockdown (200(+++), 100(++), 50(+)nM).
(E) Western blot for SRC3, pS6, and SPOP protein from PtenL/L (control) and two distinct PtenL/L;SPOP-F133V (SPOPmut) mouse prostate organoids, with control siRNA or SRC3 knockdown (100nM).
See also Figure S6.

