
Fig. 1.
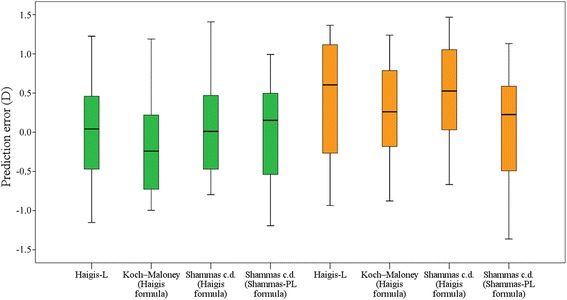
Box plot of prediction errors for each method. Green color represents measurements from IOL-Master. Yellow color represents measurements from AL-3000 and TMS-4
Official websites use .gov
A
.gov website belongs to an official
government organization in the United States.
Secure .gov websites use HTTPS
A lock (
) or https:// means you've safely
connected to the .gov website. Share sensitive
information only on official, secure websites.
Box plot of prediction errors for each method. Green color represents measurements from IOL-Master. Yellow color represents measurements from AL-3000 and TMS-4