
Fig. 2.
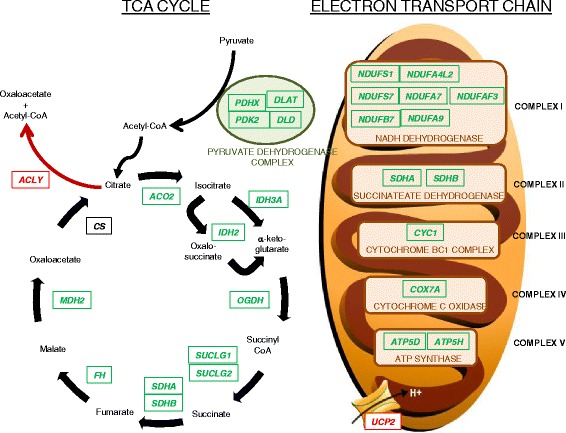
Diagram of TCA cycle and electron transport chain is shown, overlaid with gene expression results from GRMD versus wild type skeletal muscle samples. All listed genes, except for citrate synthase (CS), were differential between GRMD and wild type dogs, and each is colored according to direction of difference. Green genes represent those that were more highly expressed in wild type relative to GRMD dogs. Only two genes (ACLY and UCP2, colored in red) were more highly expressed in GRMD relative to control dogs