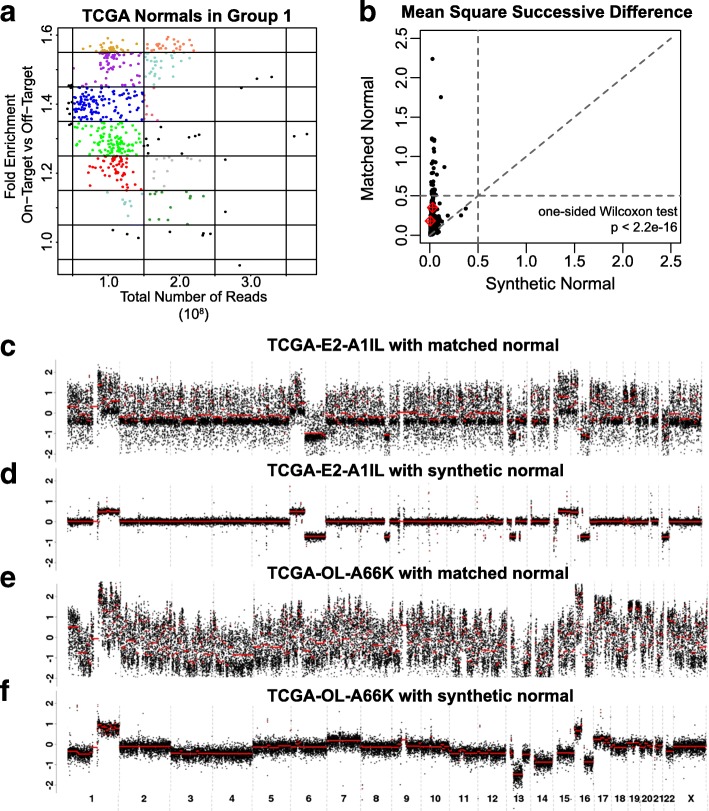
Fig. 3.
Generation of synthetic normal and improvement of technical noise with synthetic normal. a Library size and fold enrichment of TCGA normals. Each color represents the normal utilized in generating the synthetic normal for that bin. b Comparison of mean square successive difference calculated by using a matched normal (y-axis) or a synthetic normal (x-axis) for all 989 TCGA breast cancer samples, with tumors from c–f marked in red. Read ratios plotted by genomic location of two TCGA breast cancers and normals from the same patient (a, c) compared to read ratios calculated from the same two tumors using a synthetic normal (b, d)

