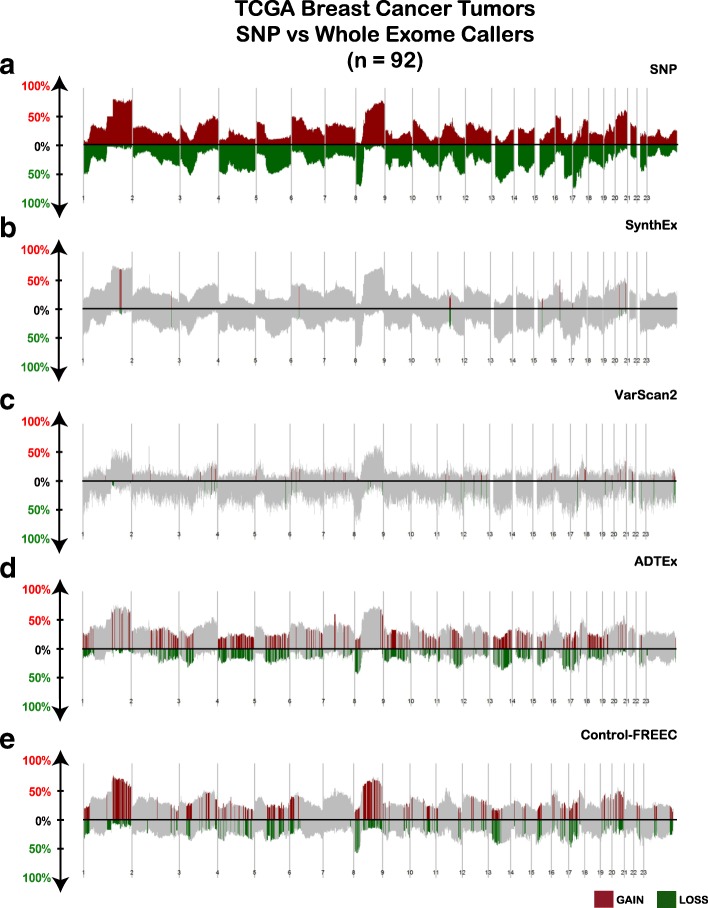
Fig. 5.
CNA genomic landscape comparing SNP arrays and whole exome sequencing tools in TCGA breast cancers. Using SWITCHplus, segments of copy number gained (above x-axis) and lost (below x-axis) are plotted from a SNP array, b SynthEx, c VarScan2, d ADTEx, and e control-FREEC. The frequency of an alteration out of the 92 tumors analyzed in each tool is indicated on the y-axis from 0–100%. Regions in red (gains) or green (loss) indicate segments that contain at least one gene whose discrete copy number alteration direction call is significantly different from SNP by Wilcoxon test

