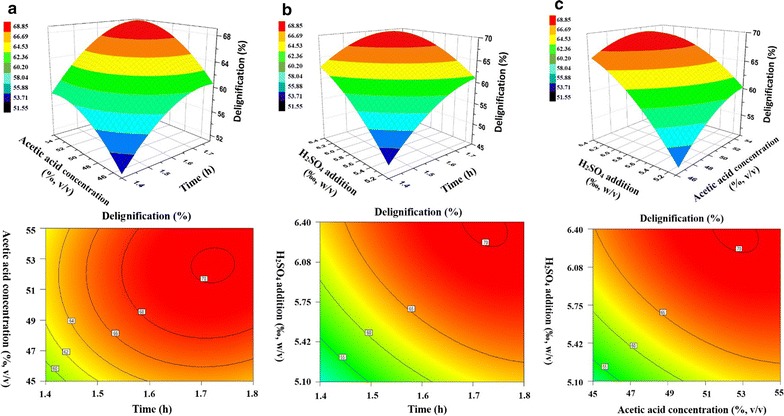
Fig. 1.

Response surface plot (3D and 2D) for the interactive effect of variables. a Effect of acetic acid concentration and pretreatment time, fixed H2SO4 addition at 0.64 (%, w/v); b effect of H2SO4 addition and pretreatment time, fixed acetic acid concentration at 52.6 (%, v/v); c effect of H2SO4 addition and acetic acid concentration, fixed pretreatment time at 1.7 h
