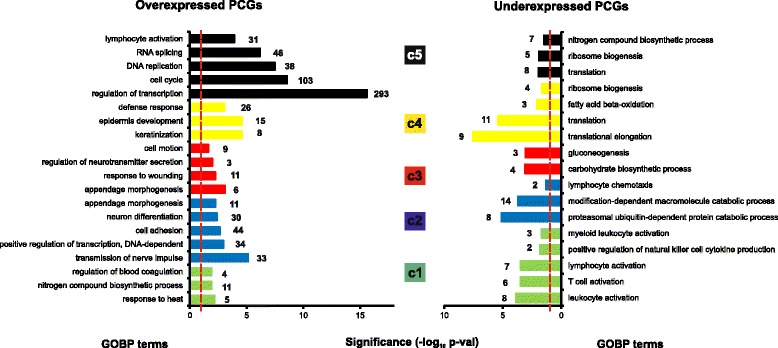
Fig. 4.

GOBP terms selected by cluster. Gene ontology analysis was done using DAVID v6.7 web tool (see the “Methods” section). Overexpressed or underexpressed PCGs are analyzed per cluster, and representative GO Biological Processes (GOBP) terms shown. Numbers at the end of each bar represent genes belonging to each GOBP term. Dashed red line denotes threshold for significant enrichment (p val <0.05)
