
Fig. 1.
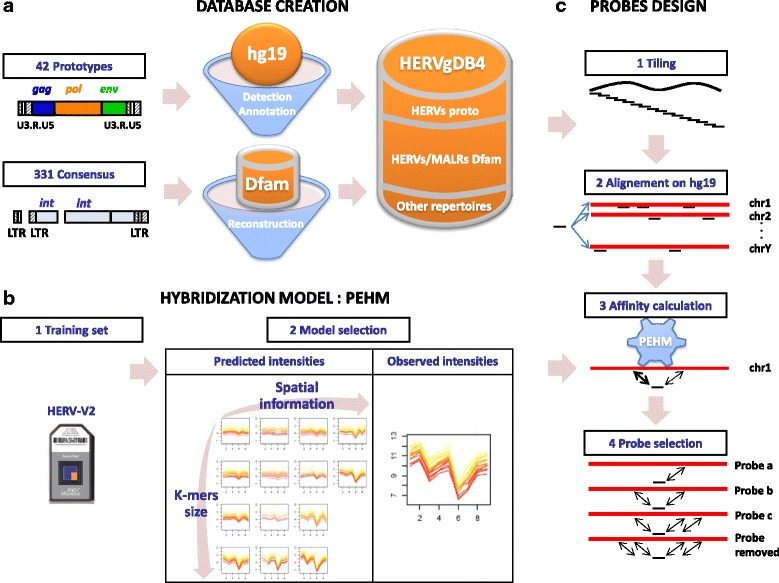
Mains steps of the HERV-V3 array design. The design involved three steps of (a) database creation, where HERV copies were either detected by RepeatMasker using 42 prototypes or reconstructed from Dfam predictions; (b) development of a hybridization model, illustrated by models predictions and observed intensities on Affymetrix probeset associated with CD59 gene; and (c) design of probes and probesets. The difference of annotation level between consensus and prototypes is shown, where LTR subregions and ORFs are only identified in prototypes. It can further be noted that the agreement between observed and predicted intensities increases with the k-mers size and the complexity of spatial information (a more thorough description is provided in the Additional file 3: Figure S1)