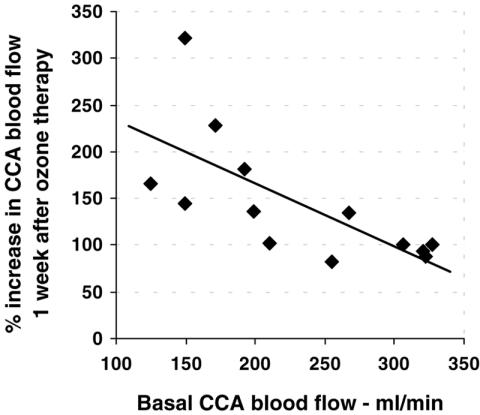
Figure 5.
Relationship between the baseline blood flow and its increase post ozone therapy. The correlation in CCA blood flow between baseline values and the percentage increase 1 week after session #3 was highly significant (r = 0.691; P = 0.009), i.e., there is a higher percentage increase in CCA corresponding to a lower initial blood flow. Note: the percentages under 100% indicate a decrease in blood flow at this time point.

