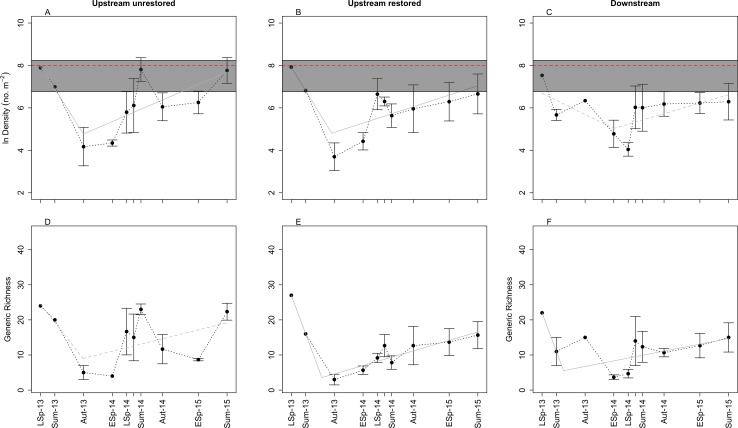
Figure 2. Plots of mean (±SE) benthic macroinvertebrate density (A–C) and generic richness (D–F) through time in the three study reaches: upstream restored (A, D), upstream unrestored (B, E), and downstream of former dam (C, F).
Seasons represented are early spring (ESp), late spring (LSp), late autumn (Aut), and summer (Sum). In (A–C), the dashed horizontal red line and gray box surrounding this line denote the mean, miniumum, and maximum (bottom and top of the rectangles, respectively) macroinvertebrate density observed from June 2014–June 2015 in the upstream reference reach (n = 5) (Vent, 2015). Grey lines indicate breakpoint regression models for each reach: solid lines highlight the reaches with marginally signficant (P < 0.10) changes in slope (A, B, E, F), the dashed line indicates no significant change in slope (C, D; P > 0.10). Estimated breakpoints occurred ∼15 (A, B, E) to 19 (F) months after dam removal. Note: y-axis in (A–C) is ln-transformed, and July 2014 data are presented, but not labeled on the x-axes for visual clarity.

