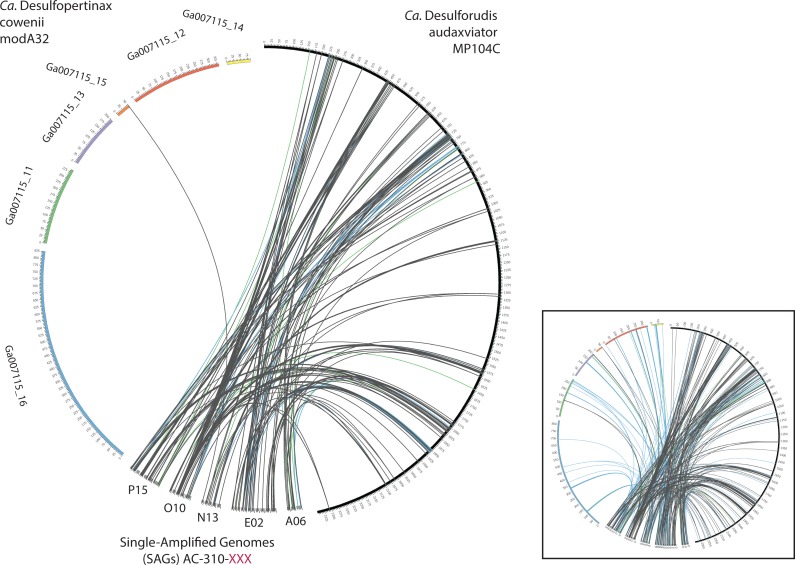
Figure 4. Analysis of genome alignment between “Ca. Desulfopertinax cowenii,” “Ca. Desulforudis audaxviator” and five closely related single-cell genomes.
Comparison of terrestrial deep subsurface SAGs AC-310-P15, O10, N13, E02, and A06 with the genomes of “Ca. Desulfopertinax cowenii” and “Ca. Desulforudis audaxviator.” Links connecting colored circles represent similarities based on blastn comparisons allowing a maximum of one best hit and using 75–80% (green), 80–85% (blue), >85% (grey) nucleic acid identity thresholds. Inset plot indicates blastn comparisons allowing a maximum of a two best hits.

