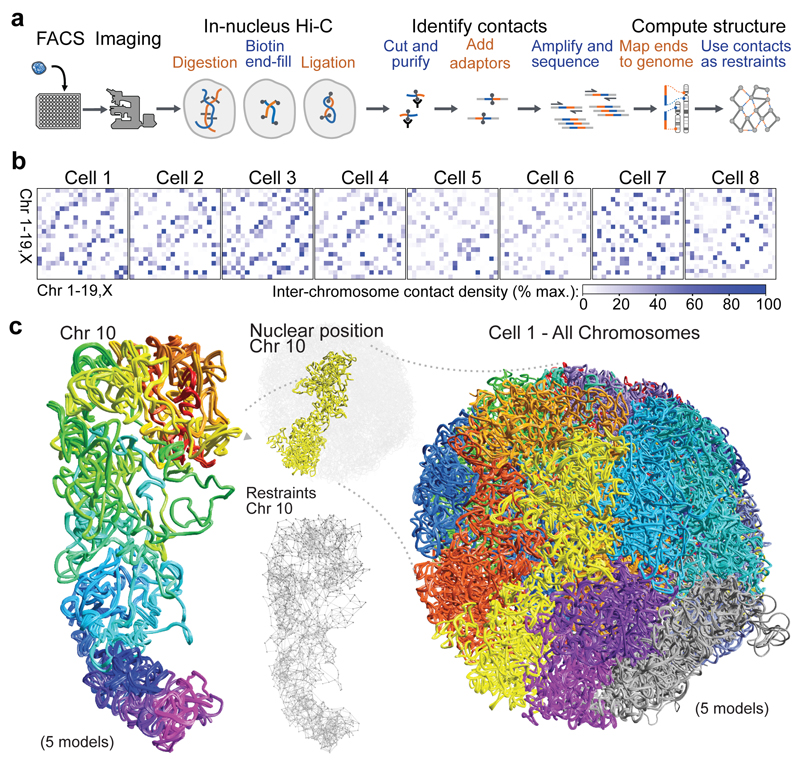
Fig. 1. Calculation of 3D genome structures from single cell Hi-C data.
a, Schematic of the protocol used to image and process single nuclei. b, Colour density matrices representing the relative number of contacts observed between different pairs of chromosomes. c, Five superimposed structures from a single cell, from repeat calculations using 100 kb particles and the same experimental data, with the chromosomes coloured differently. An expanded view of Chromosome 10 is shown, coloured from red through to purple (centromere to telomere), together with an illustration of the restraints determining its structure.

